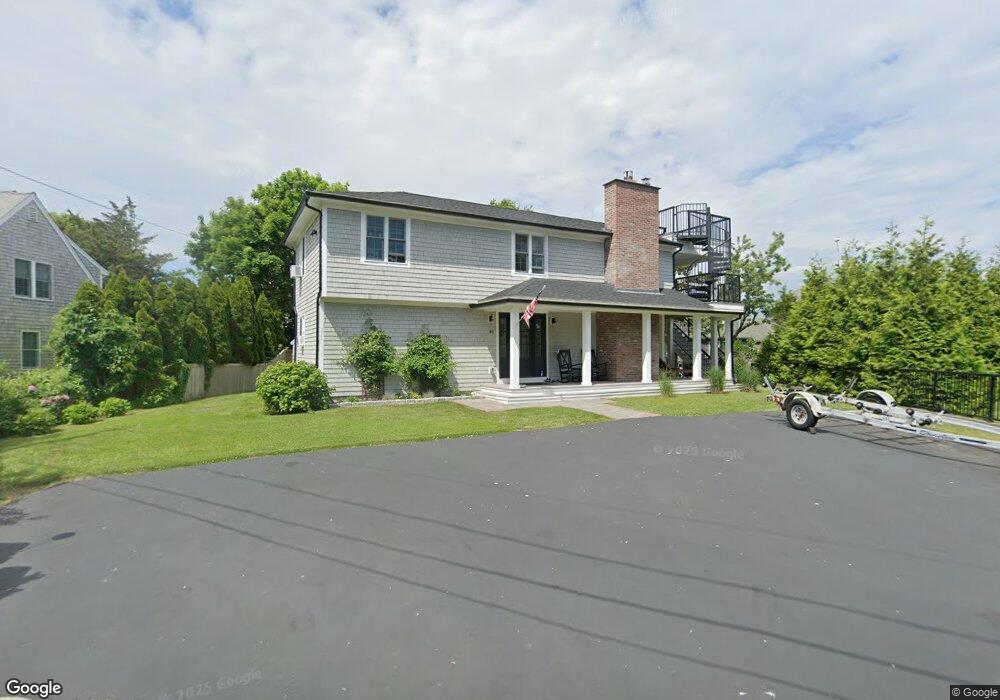
45 Meridan Way Barnstable, MA 02630
Barnstable Village NeighborhoodEstimated Value: $1,016,000 - $1,118,000
3
Beds
2
Baths
1,394
Sq Ft
$778/Sq Ft
Est. Value
About This Home
This home is located at 45 Meridan Way, Barnstable, MA 02630 and is currently estimated at $1,083,903, approximately $777 per square foot. 45 Meridan Way is a home located in Barnstable County with nearby schools including West Barnstable Elementary School, Barnstable United Elementary School, and Barnstable Intermediate School.
Ownership History
Date
Name
Owned For
Owner Type
Purchase Details
Closed on
Jul 18, 2019
Sold by
45 Meridian Way Llc
Bought by
Janina Wright Ret
Current Estimated Value
Purchase Details
Closed on
Dec 8, 2015
Sold by
Wright Glenn A
Bought by
45 Meridian Way Llc
Create a Home Valuation Report for This Property
The Home Valuation Report is an in-depth analysis detailing your home's value as well as a comparison with similar homes in the area
Home Values in the Area
Average Home Value in this Area
Purchase History
| Date | Buyer | Sale Price | Title Company |
|---|---|---|---|
| Janina Wright Ret | -- | -- | |
| 45 Meridian Way Llc | -- | -- |
Source: Public Records
Tax History Compared to Growth
Tax History
| Year | Tax Paid | Tax Assessment Tax Assessment Total Assessment is a certain percentage of the fair market value that is determined by local assessors to be the total taxable value of land and additions on the property. | Land | Improvement |
|---|---|---|---|---|
| 2025 | $8,697 | $941,200 | $530,900 | $410,300 |
| 2024 | $9,795 | $1,118,100 | $730,000 | $388,100 |
| 2023 | $8,420 | $937,600 | $603,300 | $334,300 |
| 2022 | $7,486 | $670,800 | $393,300 | $277,500 |
| 2021 | $7,191 | $614,100 | $357,500 | $256,600 |
| 2020 | $6,662 | $543,400 | $357,500 | $185,900 |
| 2019 | $6,859 | $561,300 | $375,400 | $185,900 |
| 2018 | $6,542 | $520,000 | $357,500 | $162,500 |
| 2017 | $6,440 | $515,200 | $357,500 | $157,700 |
| 2016 | $6,770 | $549,100 | $391,400 | $157,700 |
| 2015 | $6,186 | $510,800 | $358,000 | $152,800 |
Source: Public Records
Map
Nearby Homes