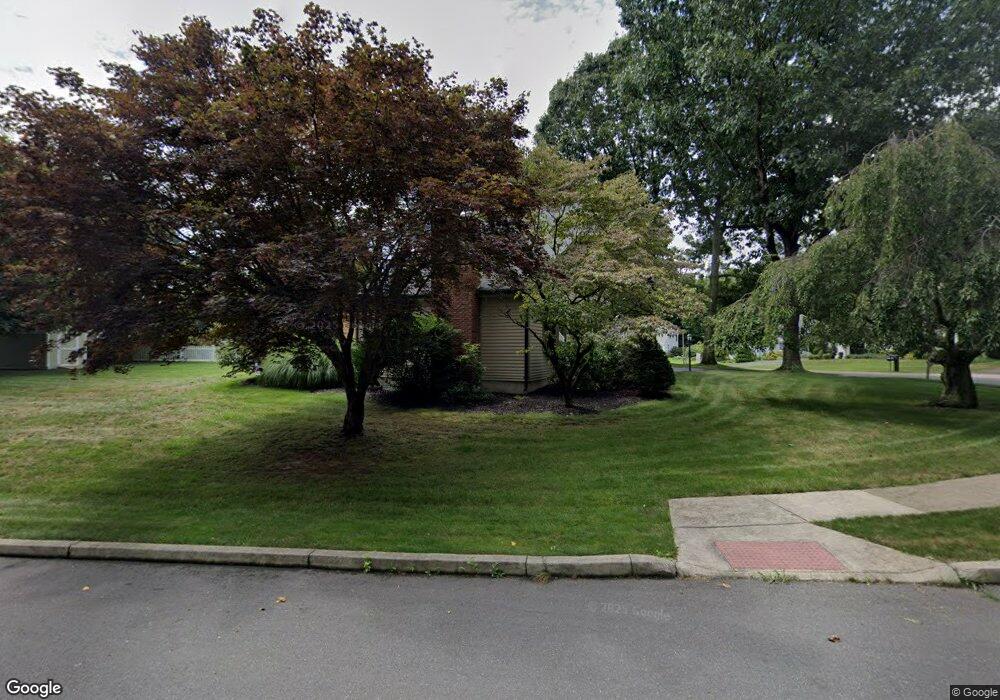
45 Miner Brook Dr Middletown, CT 06457
Westfield NeighborhoodEstimated Value: $418,346 - $483,000
3
Beds
3
Baths
1,435
Sq Ft
$304/Sq Ft
Est. Value
About This Home
This home is located at 45 Miner Brook Dr, Middletown, CT 06457 and is currently estimated at $436,837, approximately $304 per square foot. 45 Miner Brook Dr is a home located in Middlesex County with nearby schools including Moody School.
Ownership History
Date
Name
Owned For
Owner Type
Purchase Details
Closed on
Aug 26, 2014
Sold by
Evans Diana and Gephard Stephen
Bought by
Battit Deborah R and Battit Demian N
Current Estimated Value
Home Financials for this Owner
Home Financials are based on the most recent Mortgage that was taken out on this home.
Original Mortgage
$234,000
Outstanding Balance
$178,624
Interest Rate
4.14%
Mortgage Type
New Conventional
Estimated Equity
$258,213
Purchase Details
Closed on
Aug 3, 1998
Sold by
Kirwin Jane
Bought by
Ahern Michael L and Ahern Debra L
Home Financials for this Owner
Home Financials are based on the most recent Mortgage that was taken out on this home.
Original Mortgage
$141,700
Interest Rate
6.92%
Mortgage Type
Unknown
Purchase Details
Closed on
Dec 20, 1996
Sold by
Gertrude A Edwards Ft
Bought by
Kirwin Jane
Home Financials for this Owner
Home Financials are based on the most recent Mortgage that was taken out on this home.
Original Mortgage
$141,700
Interest Rate
7.62%
Mortgage Type
Unknown
Create a Home Valuation Report for This Property
The Home Valuation Report is an in-depth analysis detailing your home's value as well as a comparison with similar homes in the area
Home Values in the Area
Average Home Value in this Area
Purchase History
| Date | Buyer | Sale Price | Title Company |
|---|---|---|---|
| Battit Deborah R | $292,500 | -- | |
| Ahern Michael L | $157,500 | -- | |
| Kirwin Jane | $154,000 | -- |
Source: Public Records
Mortgage History
| Date | Status | Borrower | Loan Amount |
|---|---|---|---|
| Open | Battit Deborah R | $234,000 | |
| Previous Owner | Kirwin Jane | $141,700 | |
| Previous Owner | Kirwin Jane | $141,700 | |
| Previous Owner | Kirwin Jane | $25,000 |
Source: Public Records
Tax History Compared to Growth
Tax History
| Year | Tax Paid | Tax Assessment Tax Assessment Total Assessment is a certain percentage of the fair market value that is determined by local assessors to be the total taxable value of land and additions on the property. | Land | Improvement |
|---|---|---|---|---|
| 2025 | $7,426 | $220,440 | $73,140 | $147,300 |
| 2024 | $7,041 | $220,440 | $73,140 | $147,300 |
| 2023 | $6,623 | $220,440 | $73,140 | $147,300 |
| 2022 | $6,041 | $161,020 | $48,760 | $112,260 |
| 2021 | $6,026 | $161,020 | $48,760 | $112,260 |
| 2020 | $6,036 | $161,020 | $48,760 | $112,260 |
| 2019 | $6,068 | $161,020 | $48,760 | $112,260 |
| 2018 | $5,852 | $161,020 | $48,760 | $112,260 |
| 2017 | $5,786 | $163,210 | $52,160 | $111,050 |
| 2016 | $5,674 | $163,210 | $52,160 | $111,050 |
| 2015 | $5,552 | $163,210 | $52,160 | $111,050 |
| 2014 | $5,553 | $163,210 | $52,160 | $111,050 |
Source: Public Records
Map
Nearby Homes
- 7 W Meadow Ln Unit 5
- 59 Fieldbrook Rd
- 67 Braeburn Ln
- 17 Flynn Ln
- 130 Carriage Crossing Ln Unit 130
- 48 Carriage Crossing Ln Unit 8108
- 7 Inverness Square
- 59 Inverness Ln
- 886 East St
- 233 Oak Ridge Dr
- 123 Webster Ln
- 128 Webster Ln
- 145 Webster Ln Unit 2-41
- 137 Webster Ln Unit 2-42
- 134 Webster Ln Unit 2-15
- 14 Rising Trail Dr
- 52 Rising Trail Dr
- 36 Rising Trail Dr Unit 36
- 100 Rising Trail Dr Unit 100
- 162 Rising Trail Dr
- 55 Miner Brook Dr
- 65 Miner Brook Dr
- 50 Miner Brook Dr
- 60 Miner Brook Dr
- 70 Miner Brook Dr
- 75 Miner Brook Dr
- 60 Miner St
- 70 Miner St
- 80 Miner Brook Dr
- 50 Miner St
- 109 Glenwood Terrace
- 99 Glenwood Terrace
- 119 Glenwood Terrace
- 89 Glenwood Terrace
- 124 Miner St
- 65 Miner St
- 129 Glenwood Terrace
- 79 Glenwood Terrace
- 77 Miner St
- 97 Miner St