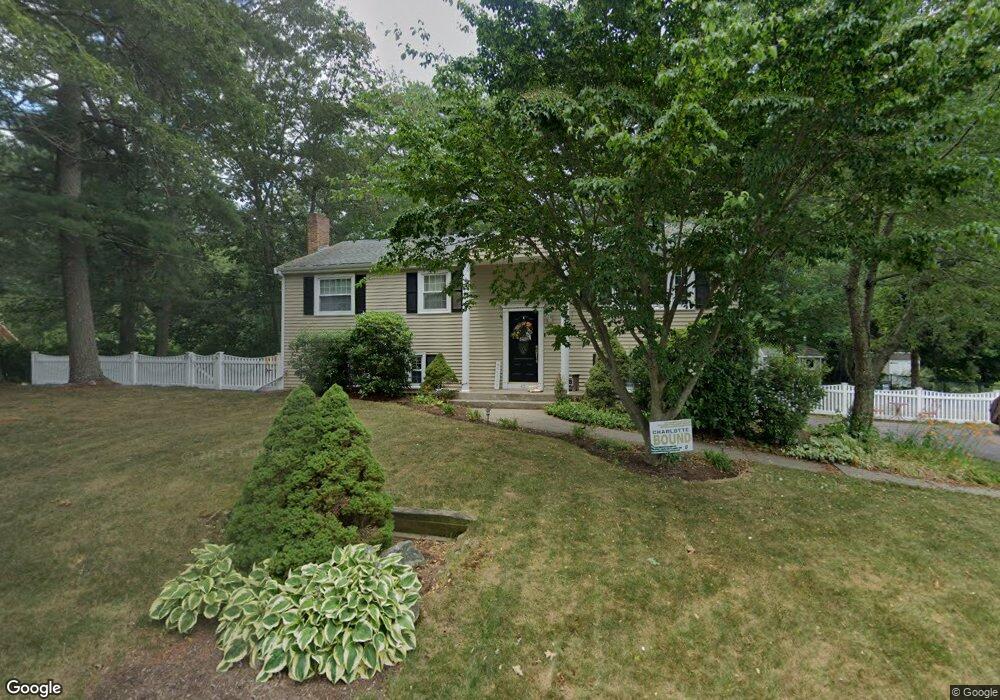
45 Morse St Foxboro, MA 02035
Estimated Value: $636,000 - $757,000
4
Beds
2
Baths
2,100
Sq Ft
$335/Sq Ft
Est. Value
About This Home
This home is located at 45 Morse St, Foxboro, MA 02035 and is currently estimated at $703,274, approximately $334 per square foot. 45 Morse St is a home located in Norfolk County with nearby schools including Foxborough High School, Hands-On-Montessori School, and St Mary's Catholic School.
Ownership History
Date
Name
Owned For
Owner Type
Purchase Details
Closed on
Aug 3, 2005
Sold by
Sweeney James A
Bought by
Leach Keith D and Massel Trina L
Current Estimated Value
Home Financials for this Owner
Home Financials are based on the most recent Mortgage that was taken out on this home.
Original Mortgage
$348,000
Outstanding Balance
$182,456
Interest Rate
5.63%
Mortgage Type
Purchase Money Mortgage
Estimated Equity
$520,818
Purchase Details
Closed on
Mar 3, 2005
Sold by
Cassery Joann B
Bought by
Sweeney James A
Home Financials for this Owner
Home Financials are based on the most recent Mortgage that was taken out on this home.
Original Mortgage
$292,500
Interest Rate
5.66%
Mortgage Type
Purchase Money Mortgage
Create a Home Valuation Report for This Property
The Home Valuation Report is an in-depth analysis detailing your home's value as well as a comparison with similar homes in the area
Home Values in the Area
Average Home Value in this Area
Purchase History
| Date | Buyer | Sale Price | Title Company |
|---|---|---|---|
| Leach Keith D | $435,000 | -- | |
| Sweeney James A | $325,000 | -- |
Source: Public Records
Mortgage History
| Date | Status | Borrower | Loan Amount |
|---|---|---|---|
| Open | Leach Keith D | $348,000 | |
| Previous Owner | Sweeney James A | $292,500 |
Source: Public Records
Tax History Compared to Growth
Tax History
| Year | Tax Paid | Tax Assessment Tax Assessment Total Assessment is a certain percentage of the fair market value that is determined by local assessors to be the total taxable value of land and additions on the property. | Land | Improvement |
|---|---|---|---|---|
| 2025 | $6,696 | $506,500 | $195,700 | $310,800 |
| 2024 | $6,635 | $491,100 | $210,900 | $280,200 |
| 2023 | $6,471 | $455,400 | $200,800 | $254,600 |
| 2022 | $6,156 | $424,000 | $180,000 | $244,000 |
| 2021 | $5,825 | $395,200 | $171,000 | $224,200 |
| 2020 | $5,424 | $372,300 | $171,000 | $201,300 |
| 2019 | $5,430 | $369,400 | $171,400 | $198,000 |
| 2018 | $5,162 | $354,300 | $162,800 | $191,500 |
| 2017 | $5,166 | $343,500 | $160,200 | $183,300 |
| 2016 | $5,153 | $347,700 | $154,100 | $193,600 |
| 2015 | $4,735 | $311,700 | $114,800 | $196,900 |
| 2014 | $4,672 | $311,700 | $114,800 | $196,900 |
Source: Public Records
Map
Nearby Homes
- 67 Morse St
- 12 Community Way
- 5 Lauren Ln
- 9 Independence Dr Unit 9
- 35 Independence Dr Unit 35
- 261 East St
- 124 E Belcher Rd
- 132 Cannon Forge Dr
- 170 Cannon Forge Dr
- 619 N Main St
- 18 Winter St Unit E
- 60 King St
- 11 W Belcher Rd Unit 5
- 28 Angell St
- 25 Winter St
- 55-57 Pine Needle Ln
- 2 Red Fox Run
- 194 Central St
- 89 Oak St
- 84 Cocasset St Unit A6