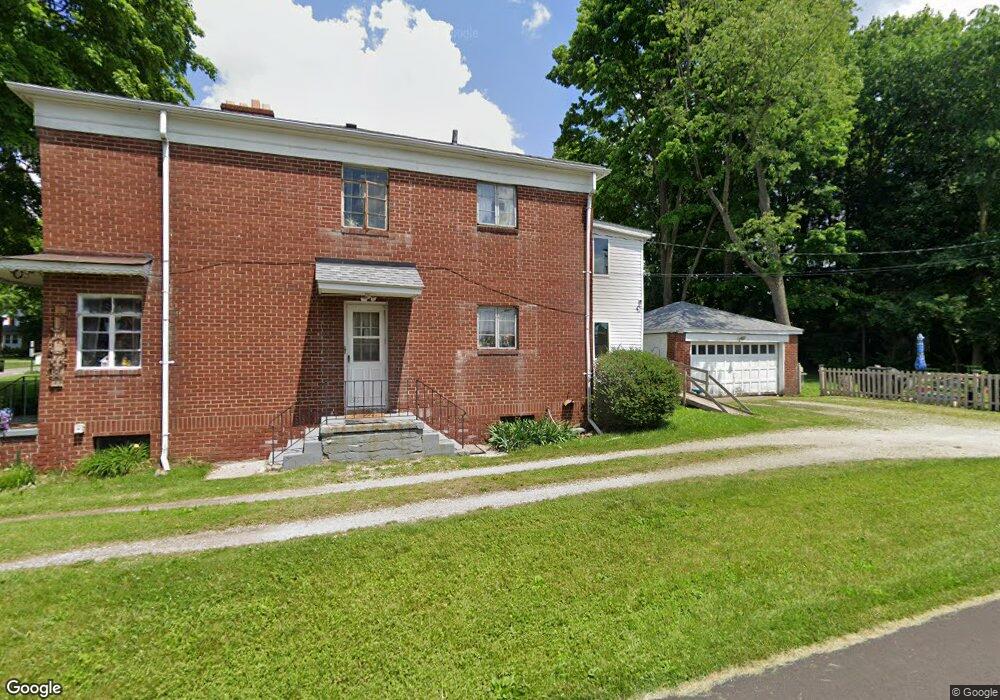
45 N Pershing Ave Unit 47 Akron, OH 44313
Northwest Akron NeighborhoodEstimated Value: $204,000 - $232,000
4
Beds
2
Baths
2,312
Sq Ft
$94/Sq Ft
Est. Value
About This Home
This home is located at 45 N Pershing Ave Unit 47, Akron, OH 44313 and is currently estimated at $218,190, approximately $94 per square foot. 45 N Pershing Ave Unit 47 is a home located in Summit County with nearby schools including Summit Academy School, Our Lady Of The Elms Elementary School, and St. Sebastian Parish School.
Ownership History
Date
Name
Owned For
Owner Type
Purchase Details
Closed on
Mar 19, 1999
Sold by
Thompson Bertha L and Thompson Helen E
Bought by
Thompson Bertha L and Thompson Blake E
Current Estimated Value
Home Financials for this Owner
Home Financials are based on the most recent Mortgage that was taken out on this home.
Original Mortgage
$125,000
Outstanding Balance
$30,744
Interest Rate
6.94%
Mortgage Type
Purchase Money Mortgage
Estimated Equity
$187,446
Purchase Details
Closed on
Jul 19, 1995
Sold by
Rose William M
Bought by
Thompson Betha L and Thompson Blake
Home Financials for this Owner
Home Financials are based on the most recent Mortgage that was taken out on this home.
Original Mortgage
$78,545
Interest Rate
7.5%
Mortgage Type
New Conventional
Create a Home Valuation Report for This Property
The Home Valuation Report is an in-depth analysis detailing your home's value as well as a comparison with similar homes in the area
Home Values in the Area
Average Home Value in this Area
Purchase History
| Date | Buyer | Sale Price | Title Company |
|---|---|---|---|
| Thompson Bertha L | -- | -- | |
| Thompson Betha L | $95,000 | -- |
Source: Public Records
Mortgage History
| Date | Status | Borrower | Loan Amount |
|---|---|---|---|
| Open | Thompson Bertha L | $125,000 | |
| Closed | Thompson Betha L | $78,545 |
Source: Public Records
Tax History
| Year | Tax Paid | Tax Assessment Tax Assessment Total Assessment is a certain percentage of the fair market value that is determined by local assessors to be the total taxable value of land and additions on the property. | Land | Improvement |
|---|---|---|---|---|
| 2024 | $3,226 | $58,689 | $9,447 | $49,242 |
| 2023 | $3,226 | $58,689 | $9,447 | $49,242 |
| 2022 | $3,033 | $43,250 | $6,895 | $36,355 |
| 2021 | $3,036 | $43,250 | $6,895 | $36,355 |
| 2020 | $3,101 | $43,260 | $6,900 | $36,360 |
| 2019 | $3,664 | $47,060 | $9,090 | $37,970 |
| 2018 | $3,618 | $47,060 | $9,090 | $37,970 |
| 2017 | $3,425 | $47,060 | $9,090 | $37,970 |
| 2016 | $3,537 | $45,140 | $9,090 | $36,050 |
| 2015 | $3,425 | $45,140 | $9,090 | $36,050 |
| 2014 | $3,398 | $45,140 | $9,090 | $36,050 |
| 2013 | $3,439 | $45,620 | $9,090 | $36,530 |
Source: Public Records
Map
Nearby Homes
- 2040 Braewick Dr
- 0 White Pond Dr Unit 5156539
- 1639 Liberty Dr
- 302 N Pershing Ave
- 242 N Hawkins Ave
- 1821 Ganyard Rd
- 365 Village Pointe Dr Unit A
- 1612 Fairfax Rd
- 1606 Fairfax Rd
- 129 Idlewild St
- 362 Village Pointe Dr
- 339 Village Pointe Dr Unit B
- 2330 Thurmont Rd
- V/L Idlewood Ave
- 373 Tremont Rd
- 2166 Ridgewood Rd
- 48 S Wheaton Rd
- 300 Melbourne Ave
- 0 Alden Ave
- 240 Sand Run Rd
- 51 N Pershing Ave Unit 53
- 57 N Pershing Ave Unit 59
- 57 N Pershing Ave Unit 59
- 37 N Pershing Ave
- 62 Greencrest Terrace Unit 64
- 65 N Pershing Ave Unit 67
- 68 Greencrest Terrace Unit 70
- 44 N Pershing Ave Unit 5
- 58 N Pershing Ave
- 38 N Pershing Ave
- 72 Greencrest Terrace Unit 74
- 25 N Pershing Ave Unit 4
- 71 N Pershing Ave Unit 73
- 80 Greencrest Terrace Unit 82
- 80 82 Greencrest Terrace
- 72 N Pershing Ave
- 86 Greencrest Terrace Unit 88
- 77 N Pershing Ave Unit 79
- 70 N Pershing Ave Unit 72
- 81 83 Greencrest Terrace
Your Personal Tour Guide
Ask me questions while you tour the home.