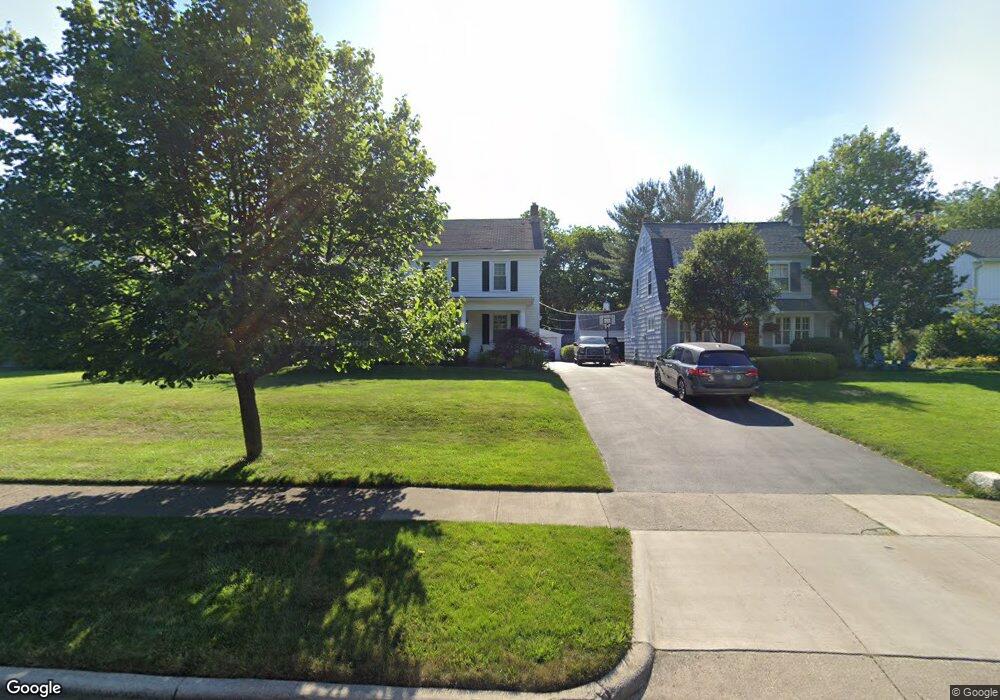
45 N Remington Rd Columbus, OH 43209
Estimated Value: $397,000 - $576,000
3
Beds
2
Baths
1,712
Sq Ft
$290/Sq Ft
Est. Value
About This Home
This home is located at 45 N Remington Rd, Columbus, OH 43209 and is currently estimated at $495,869, approximately $289 per square foot. 45 N Remington Rd is a home located in Franklin County with nearby schools including Maryland Elementary School, Bexley Middle School, and Bexley High School.
Ownership History
Date
Name
Owned For
Owner Type
Purchase Details
Closed on
Jul 16, 2016
Sold by
Robinson Amy J and Jones Amy R
Bought by
Jones Brian K
Current Estimated Value
Purchase Details
Closed on
Feb 15, 2010
Sold by
Armstrong Kathy and Estate Of Ann W Metz
Bought by
Jones Brian K and Jones Amy R
Home Financials for this Owner
Home Financials are based on the most recent Mortgage that was taken out on this home.
Original Mortgage
$126,800
Interest Rate
5.11%
Mortgage Type
New Conventional
Purchase Details
Closed on
Jul 2, 1991
Bought by
Metz Ann W
Create a Home Valuation Report for This Property
The Home Valuation Report is an in-depth analysis detailing your home's value as well as a comparison with similar homes in the area
Home Values in the Area
Average Home Value in this Area
Purchase History
| Date | Buyer | Sale Price | Title Company |
|---|---|---|---|
| Jones Brian K | -- | None Available | |
| Jones Brian K | $158,500 | Valmer La | |
| Metz Ann W | $47,400 | -- |
Source: Public Records
Mortgage History
| Date | Status | Borrower | Loan Amount |
|---|---|---|---|
| Previous Owner | Jones Brian K | $126,800 |
Source: Public Records
Tax History Compared to Growth
Tax History
| Year | Tax Paid | Tax Assessment Tax Assessment Total Assessment is a certain percentage of the fair market value that is determined by local assessors to be the total taxable value of land and additions on the property. | Land | Improvement |
|---|---|---|---|---|
| 2024 | $8,389 | $151,070 | $69,480 | $81,590 |
| 2023 | $7,543 | $151,060 | $69,475 | $81,585 |
| 2022 | $7,747 | $124,610 | $54,710 | $69,900 |
| 2021 | $7,753 | $124,610 | $54,710 | $69,900 |
| 2020 | $7,685 | $124,610 | $54,710 | $69,900 |
| 2019 | $7,264 | $103,640 | $45,610 | $58,030 |
| 2018 | $5,582 | $103,640 | $45,610 | $58,030 |
| 2017 | $6,160 | $103,640 | $45,610 | $58,030 |
| 2016 | $4,838 | $74,380 | $33,430 | $40,950 |
| 2015 | $4,852 | $74,380 | $33,430 | $40,950 |
| 2014 | $4,880 | $74,380 | $33,430 | $40,950 |
| 2013 | $2,537 | $74,375 | $33,425 | $40,950 |
Source: Public Records
Map
Nearby Homes
- 2738 E Broad St
- 2717 E Broad St
- 2629 E Broad St
- 95 S Stanwood Rd
- 257 N Cassingham Rd
- 123 S Gould Rd
- 124 N Gould Rd
- 208 S Stanwood Rd
- 142 S Gould Rd
- 50 N Broadleigh Rd
- 205 N Gould Rd
- 228 S Ardmore Rd
- 50 S Chesterfield Rd
- 2867 Ruhl Ave Unit 869
- 291 N Drexel Ave
- 2779 Columbus Ave
- 268 S Cassady Ave
- 2695 Bellwood Ave
- 189 N Parkview Ave
- 2788 Allegheny Ave
- 51 N Remington Rd
- 33 N Remington Rd
- 57 N Remington Rd
- 50 N Cassingham Rd
- 44 N Cassingham Rd
- 63 N Remington Rd
- 56 N Cassingham Rd
- 62 N Cassingham Rd
- 69 N Remington Rd
- 36 N Cassingham Rd
- 34 N Remington Rd
- 40 N Remington Rd
- 48 N Remington Rd
- 54 N Remington Rd
- 75 N Remington Rd
- 76 N Cassingham Rd
- 2674 E Broad St
- 60 N Remington Rd
- 2714 E Broad St
- 66 N Remington Rd