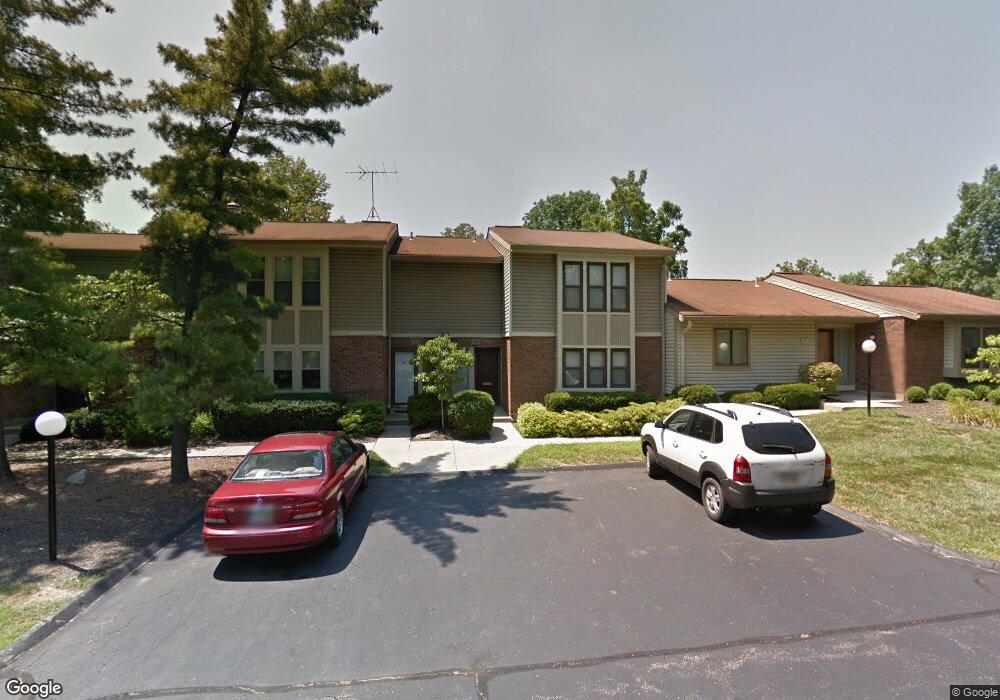
45 Oakwood Ct Cincinnati, OH 45246
Estimated Value: $209,000 - $211,000
3
Beds
3
Baths
1,620
Sq Ft
$129/Sq Ft
Est. Value
About This Home
This home is located at 45 Oakwood Ct, Cincinnati, OH 45246 and is currently estimated at $209,667, approximately $129 per square foot. 45 Oakwood Ct is a home with nearby schools including Springdale Elementary School, Princeton Community Middle School, and Princeton High School.
Ownership History
Date
Name
Owned For
Owner Type
Purchase Details
Closed on
Jul 2, 2019
Sold by
Miller Rodney A and Miller Fannie B
Bought by
Miller Rodney A and Miller Fannie B
Current Estimated Value
Create a Home Valuation Report for This Property
The Home Valuation Report is an in-depth analysis detailing your home's value as well as a comparison with similar homes in the area
Home Values in the Area
Average Home Value in this Area
Purchase History
| Date | Buyer | Sale Price | Title Company |
|---|---|---|---|
| Miller Rodney A | -- | None Available |
Source: Public Records
Tax History Compared to Growth
Tax History
| Year | Tax Paid | Tax Assessment Tax Assessment Total Assessment is a certain percentage of the fair market value that is determined by local assessors to be the total taxable value of land and additions on the property. | Land | Improvement |
|---|---|---|---|---|
| 2024 | $2,275 | $62,930 | $7,070 | $55,860 |
| 2023 | $2,316 | $62,930 | $7,070 | $55,860 |
| 2022 | $1,746 | $41,720 | $5,425 | $36,295 |
| 2021 | $1,688 | $41,720 | $5,425 | $36,295 |
| 2020 | $1,722 | $41,720 | $5,425 | $36,295 |
| 2019 | $1,105 | $28,364 | $5,425 | $22,939 |
| 2018 | $1,039 | $28,364 | $5,425 | $22,939 |
| 2017 | $969 | $28,364 | $5,425 | $22,939 |
| 2016 | $1,284 | $34,580 | $5,425 | $29,155 |
| 2015 | $1,304 | $34,580 | $5,425 | $29,155 |
| 2014 | $1,309 | $34,580 | $5,425 | $29,155 |
| 2013 | $1,280 | $34,580 | $5,425 | $29,155 |
Source: Public Records
Map
Nearby Homes
- 43 Oakwood Ct
- 21 Aspen Ct
- 659 W Kemper Rd
- 692 W Kemper Rd
- 576 Grandin Ave
- 11566 Rose Ln
- 11649 Kenn Rd
- 515 Grandin Ave
- 755 Hanson Dr
- 11435 Fitchburg Ln
- 778 Hinton Place
- 12069 Cantrell Dr
- 11907 Lawnview Ave
- 11386 Fremantle Dr
- 11442 Gresham Place
- 12189 Kenn Rd
- 278 Centerbury Ct
- 11696 Hinkley Dr
- 275 Bennington Way
- 918 Glasgow Dr