Estimated Value: $1,469,000 - $1,772,000
3
Beds
2
Baths
1,762
Sq Ft
$931/Sq Ft
Est. Value
About This Home
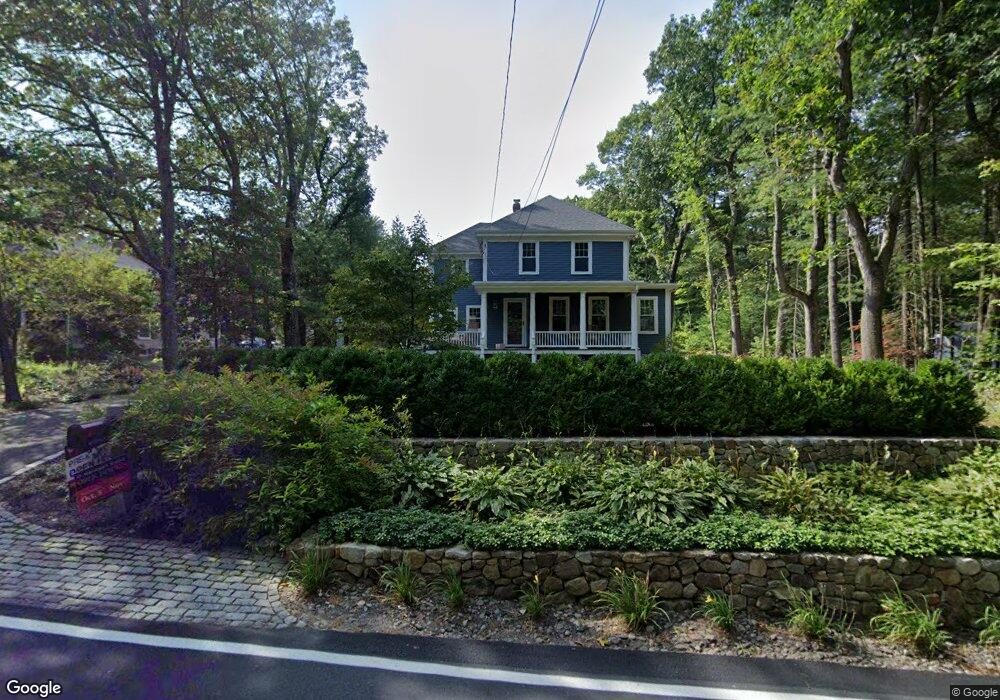
This home is located at 45 Pine St, Dover, MA 02030 and is currently estimated at $1,640,921, approximately $931 per square foot. 45 Pine St is a home located in Norfolk County with nearby schools including Chickering Elementary School, Dover-Sherborn Regional Middle School, and Dover-Sherborn Regional High School.
Ownership History
Date
Name
Owned For
Owner Type
Purchase Details
Closed on
Nov 3, 2011
Sold by
Gray Bruce W
Bought by
Barclay Todd C and Barclay Dori A
Current Estimated Value
Home Financials for this Owner
Home Financials are based on the most recent Mortgage that was taken out on this home.
Original Mortgage
$458,085
Outstanding Balance
$310,098
Interest Rate
3.87%
Mortgage Type
FHA
Estimated Equity
$1,330,823
Purchase Details
Closed on
Feb 22, 2010
Sold by
Gray Bruce W and Gray Martha H
Bought by
Gray Bruce W
Create a Home Valuation Report for This Property
The Home Valuation Report is an in-depth analysis detailing your home's value as well as a comparison with similar homes in the area
Home Values in the Area
Average Home Value in this Area
Purchase History
| Date | Buyer | Sale Price | Title Company |
|---|---|---|---|
| Barclay Todd C | $444,000 | -- | |
| Gray Bruce W | -- | -- |
Source: Public Records
Mortgage History
| Date | Status | Borrower | Loan Amount |
|---|---|---|---|
| Open | Barclay Todd C | $458,085 |
Source: Public Records
Tax History
| Year | Tax Paid | Tax Assessment Tax Assessment Total Assessment is a certain percentage of the fair market value that is determined by local assessors to be the total taxable value of land and additions on the property. | Land | Improvement |
|---|---|---|---|---|
| 2025 | $15,062 | $1,336,500 | $586,500 | $750,000 |
| 2024 | $14,218 | $1,297,300 | $547,300 | $750,000 |
| 2023 | $12,617 | $1,035,000 | $477,900 | $557,100 |
| 2022 | $12,239 | $985,400 | $438,700 | $546,700 |
| 2021 | $12,011 | $931,800 | $379,900 | $551,900 |
| 2020 | $11,699 | $911,100 | $379,900 | $531,200 |
| 2019 | $11,781 | $911,100 | $379,900 | $531,200 |
| 2018 | $11,394 | $887,400 | $379,900 | $507,500 |
| 2017 | $11,759 | $901,100 | $330,900 | $570,200 |
| 2016 | $6,354 | $493,300 | $321,100 | $172,200 |
| 2015 | $6,683 | $526,200 | $350,500 | $175,700 |
Source: Public Records
Map
Nearby Homes
Your Personal Tour Guide
Ask me questions while you tour the home.