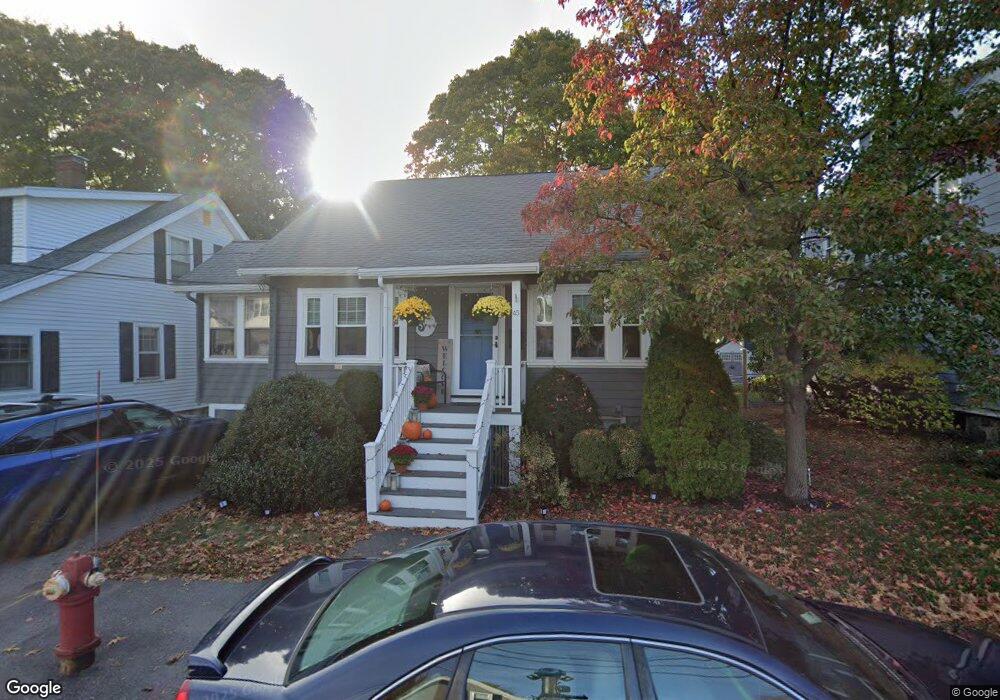
45 Pine St Wakefield, MA 01880
Greenwood NeighborhoodEstimated Value: $704,833 - $816,000
3
Beds
2
Baths
1,680
Sq Ft
$463/Sq Ft
Est. Value
About This Home
This home is located at 45 Pine St, Wakefield, MA 01880 and is currently estimated at $777,708, approximately $462 per square foot. 45 Pine St is a home located in Middlesex County with nearby schools including Wakefield Memorial High School, Mystic Valley Regional Charter School, and Pioneer Charter School Of Science II.
Ownership History
Date
Name
Owned For
Owner Type
Purchase Details
Closed on
May 29, 2008
Sold by
Hill Brian H and Hill Stephanie L
Bought by
Degray Andrea D and Degray Jason M
Current Estimated Value
Home Financials for this Owner
Home Financials are based on the most recent Mortgage that was taken out on this home.
Original Mortgage
$368,231
Interest Rate
5.91%
Mortgage Type
Purchase Money Mortgage
Purchase Details
Closed on
Sep 3, 2003
Sold by
Ryan Kathleen H and Ryan John E
Bought by
Hill Brian H and Hill Stephanie L
Home Financials for this Owner
Home Financials are based on the most recent Mortgage that was taken out on this home.
Original Mortgage
$248,000
Interest Rate
6.02%
Mortgage Type
Purchase Money Mortgage
Purchase Details
Closed on
Jul 30, 1997
Sold by
Mcmanama Peter and Mcmanama Linda R
Bought by
Ryan Kathleen H and Ryan John E
Create a Home Valuation Report for This Property
The Home Valuation Report is an in-depth analysis detailing your home's value as well as a comparison with similar homes in the area
Home Values in the Area
Average Home Value in this Area
Purchase History
| Date | Buyer | Sale Price | Title Company |
|---|---|---|---|
| Degray Andrea D | $375,000 | -- | |
| Hill Brian H | $368,000 | -- | |
| Ryan Kathleen H | $175,000 | -- | |
| Ryan Kathleen H | $175,000 | -- |
Source: Public Records
Mortgage History
| Date | Status | Borrower | Loan Amount |
|---|---|---|---|
| Open | Ryan Kathleen H | $369,570 | |
| Closed | Degray Andrea D | $368,231 | |
| Previous Owner | Hill Brian H | $248,000 |
Source: Public Records
Tax History
| Year | Tax Paid | Tax Assessment Tax Assessment Total Assessment is a certain percentage of the fair market value that is determined by local assessors to be the total taxable value of land and additions on the property. | Land | Improvement |
|---|---|---|---|---|
| 2025 | $6,955 | $612,800 | $330,600 | $282,200 |
| 2024 | $6,854 | $609,200 | $328,700 | $280,500 |
| 2023 | $6,518 | $555,700 | $299,800 | $255,900 |
| 2022 | $6,235 | $506,100 | $273,000 | $233,100 |
| 2021 | $6,035 | $474,100 | $254,500 | $219,600 |
| 2020 | $5,660 | $443,200 | $237,900 | $205,300 |
| 2019 | $5,407 | $421,400 | $226,200 | $195,200 |
| 2018 | $5,038 | $389,000 | $208,700 | $180,300 |
| 2017 | $4,624 | $354,900 | $195,000 | $159,900 |
| 2016 | $4,600 | $341,000 | $184,500 | $156,500 |
| 2015 | $4,296 | $318,700 | $172,400 | $146,300 |
| 2014 | $3,917 | $306,500 | $165,800 | $140,700 |
Source: Public Records
Map
Nearby Homes
- 62 Golden Hills Rd
- 7 West St
- 9 Ledge St
- 38 Morgan Ave
- 176 Bay State Rd
- 24 Mount Zion Rd
- 98 Boardman Ave
- 15 Belmont Rd
- 129 Greenwood St
- 824 Main St Unit 1
- 11 Ludlow Ave
- 9 Lovis Ave
- 12 Lovis Ave
- 34-36 W Highland Ave
- 1 Sidney St
- 23 Ellsworth Ave
- 601 Franklin St Unit 2
- 60 Franklin St Unit 60
- 58 Franklin St Unit 58
- 24 Ellsworth Ave
Your Personal Tour Guide
Ask me questions while you tour the home.