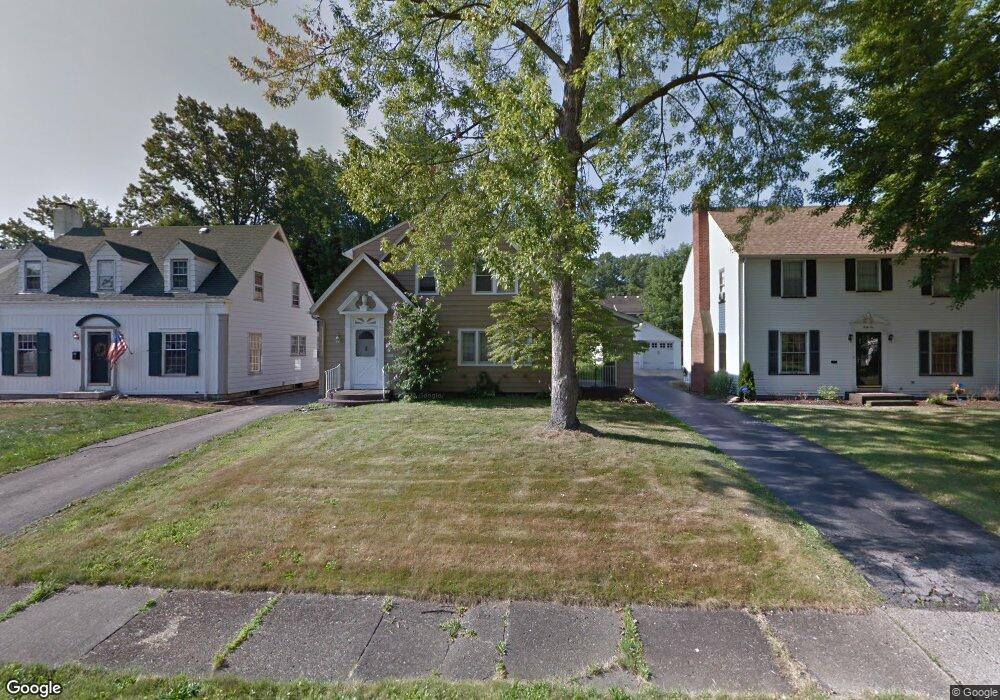
45 Pinehurst Ave Youngstown, OH 44512
Estimated Value: $137,000 - $184,000
3
Beds
2
Baths
2,484
Sq Ft
$62/Sq Ft
Est. Value
About This Home
This home is located at 45 Pinehurst Ave, Youngstown, OH 44512 and is currently estimated at $153,812, approximately $61 per square foot. 45 Pinehurst Ave is a home located in Mahoning County with nearby schools including Taft Elementary School, Williamson Elementary School, and East High School.
Ownership History
Date
Name
Owned For
Owner Type
Purchase Details
Closed on
Mar 2, 2015
Sold by
Spivey John
Bought by
Better Life Foundation Llc
Current Estimated Value
Purchase Details
Closed on
Apr 8, 2003
Sold by
Va
Bought by
Spivey John
Home Financials for this Owner
Home Financials are based on the most recent Mortgage that was taken out on this home.
Original Mortgage
$61,000
Interest Rate
5.76%
Mortgage Type
Seller Take Back
Purchase Details
Closed on
Jun 8, 2002
Sold by
Martin Tinkler and Martin Cheryl L
Bought by
Va
Purchase Details
Closed on
Jan 8, 1998
Sold by
Roncone Anthony Walter and Roncone Patricia Marie
Bought by
Tinkler Martin and Tinkler Cheryl L
Home Financials for this Owner
Home Financials are based on the most recent Mortgage that was taken out on this home.
Original Mortgage
$77,000
Interest Rate
7.26%
Purchase Details
Closed on
Jan 1, 1990
Bought by
Roncone Anthony W and Roncone P
Create a Home Valuation Report for This Property
The Home Valuation Report is an in-depth analysis detailing your home's value as well as a comparison with similar homes in the area
Home Values in the Area
Average Home Value in this Area
Purchase History
| Date | Buyer | Sale Price | Title Company |
|---|---|---|---|
| Better Life Foundation Llc | $27,500 | Bauman Land Title Agency Inc | |
| Spivey John | -- | Bauman Land Title Agency Inc | |
| Spivey John | -- | -- | |
| Va | -- | U S Title Agency Inc | |
| Tinkler Martin | $75,500 | -- | |
| Roncone Anthony W | -- | -- |
Source: Public Records
Mortgage History
| Date | Status | Borrower | Loan Amount |
|---|---|---|---|
| Previous Owner | Spivey John | $61,000 | |
| Previous Owner | Tinkler Martin | $77,000 |
Source: Public Records
Tax History
| Year | Tax Paid | Tax Assessment Tax Assessment Total Assessment is a certain percentage of the fair market value that is determined by local assessors to be the total taxable value of land and additions on the property. | Land | Improvement |
|---|---|---|---|---|
| 2025 | $1,623 | $37,720 | $2,100 | $35,620 |
| 2024 | $1,842 | $37,720 | $2,100 | $35,620 |
| 2023 | $1,829 | $37,720 | $2,100 | $35,620 |
| 2022 | $1,389 | $20,990 | $2,120 | $18,870 |
| 2021 | $1,323 | $20,990 | $2,120 | $18,870 |
| 2020 | $1,331 | $20,990 | $2,120 | $18,870 |
| 2019 | $1,336 | $18,910 | $1,910 | $17,000 |
| 2018 | $1,417 | $18,910 | $1,910 | $17,000 |
| 2017 | $1,347 | $18,910 | $1,910 | $17,000 |
| 2016 | $2,520 | $17,680 | $2,290 | $15,390 |
| 2015 | $1,361 | $17,680 | $2,290 | $15,390 |
| 2014 | $1,139 | $17,680 | $2,290 | $15,390 |
| 2013 | $1,124 | $17,680 | $2,290 | $15,390 |
Source: Public Records
Map
Nearby Homes
- 28 Jennette Dr
- 4441 Southern Blvd
- 4144 Helena Ave
- 94 Jennette Dr
- 4717 Market St
- 132 Jennette Dr
- 63 Clifton Dr
- 4127 Southern Blvd
- 28 Terrace Dr
- 86 Terrace Dr
- 4250 Oak Knoll Dr
- 4941 Market St
- 4833 Oak Knoll Dr
- 144 Mill Creek Dr
- 3916 Howard St
- 196 Maywood Dr
- 4141 Windsor Rd
- 189 Beechwood Dr
- 153 Overhill Rd
- 4225 Stratford Rd
- 47 Pinehurst Ave
- 41 Pinehurst Ave
- 51 Pinehurst Ave
- 37 Pinehurst Ave
- 38 Maple Dr
- 33 Pinehurst Ave
- 53 Pinehurst Ave
- 42 Maple Dr
- 34 Maple Dr
- 46 Maple Dr
- 30 Maple Dr
- 46 Pinehurst Ave
- 50 Pinehurst Ave
- 29 Pinehurst Ave
- 42 Pinehurst Ave
- 55 Pinehurst Ave
- 54 Pinehurst Ave
- 26 Maple Dr
- 38 Pinehurst Ave
- 50 Maple Dr
Your Personal Tour Guide
Ask me questions while you tour the home.