Estimated Value: $696,995 - $906,000
4
Beds
2
Baths
1,676
Sq Ft
$462/Sq Ft
Est. Value
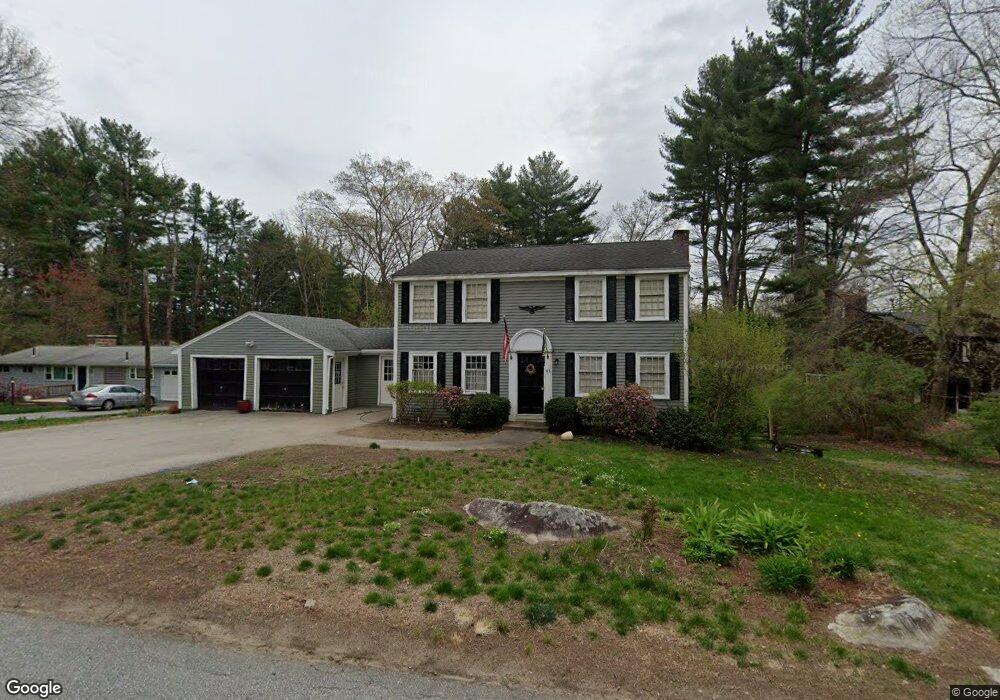
About This Home
This home is located at 45 Quaboag Rd, Acton, MA 01720 and is currently estimated at $774,749, approximately $462 per square foot. 45 Quaboag Rd is a home located in Middlesex County with nearby schools including Acton-Boxborough Regional High School and Oak Meadow Montessori School.
Ownership History
Date
Name
Owned For
Owner Type
Purchase Details
Closed on
Jan 27, 2005
Sold by
Campbell Anne E and Campbell John E
Bought by
Tobin Alison and Tobin Jon
Current Estimated Value
Home Financials for this Owner
Home Financials are based on the most recent Mortgage that was taken out on this home.
Original Mortgage
$416,500
Outstanding Balance
$210,585
Interest Rate
5.67%
Mortgage Type
Purchase Money Mortgage
Estimated Equity
$564,164
Create a Home Valuation Report for This Property
The Home Valuation Report is an in-depth analysis detailing your home's value as well as a comparison with similar homes in the area
Home Values in the Area
Average Home Value in this Area
Purchase History
| Date | Buyer | Sale Price | Title Company |
|---|---|---|---|
| Tobin Alison | $490,000 | -- |
Source: Public Records
Mortgage History
| Date | Status | Borrower | Loan Amount |
|---|---|---|---|
| Open | Tobin Alison | $416,500 |
Source: Public Records
Tax History
| Year | Tax Paid | Tax Assessment Tax Assessment Total Assessment is a certain percentage of the fair market value that is determined by local assessors to be the total taxable value of land and additions on the property. | Land | Improvement |
|---|---|---|---|---|
| 2025 | $9,973 | $581,500 | $313,600 | $267,900 |
| 2024 | $9,409 | $564,400 | $313,600 | $250,800 |
| 2023 | $9,131 | $520,000 | $285,000 | $235,000 |
| 2022 | $8,671 | $445,800 | $247,800 | $198,000 |
| 2021 | $8,652 | $427,700 | $229,500 | $198,200 |
| 2020 | $8,185 | $425,400 | $229,500 | $195,900 |
| 2019 | $7,777 | $401,500 | $229,500 | $172,000 |
| 2018 | $7,676 | $396,100 | $229,500 | $166,600 |
| 2017 | $7,496 | $393,300 | $229,500 | $163,800 |
| 2016 | $7,407 | $385,200 | $229,500 | $155,700 |
| 2015 | $7,753 | $407,000 | $229,500 | $177,500 |
| 2014 | $7,580 | $389,700 | $229,500 | $160,200 |
Source: Public Records
Map
Nearby Homes
- 5 Perkins Ln
- 20 Joseph Reed Ln
- 4 Littlefield Rd
- 235 Arlington St
- 79 Charter Rd
- 60 Nashoba Rd
- 246 Main St Unit 2
- 18 Hayward Rd
- 92 Willow St Unit 3
- 92 Willow St Unit 2
- 90 Willow St Unit 1
- 7 Kelley Rd
- 11 Braebrook
- 184 Main St Unit 3
- 4 Omega Way
- 46 Taylor Rd
- 33 Meadowbrook Rd
- 25 Nylander Way
- 129 Main St Unit 129
- 131 Main St
Your Personal Tour Guide
Ask me questions while you tour the home.