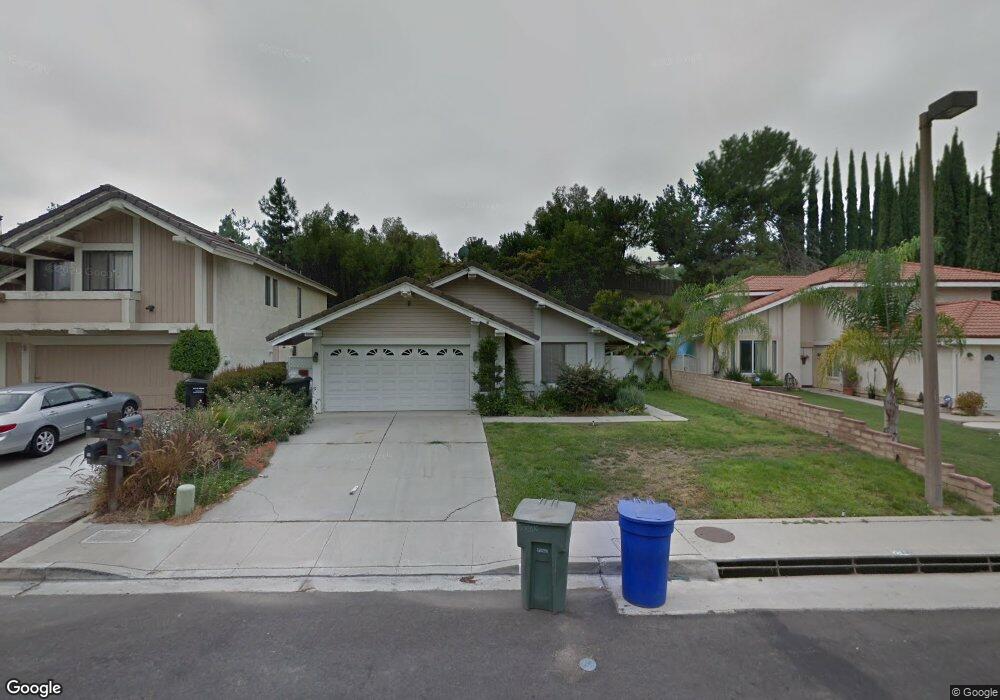
45 Rising Hill Rd Pomona, CA 91766
Estimated Value: $853,000 - $909,000
3
Beds
2
Baths
1,635
Sq Ft
$538/Sq Ft
Est. Value
About This Home
This home is located at 45 Rising Hill Rd, Pomona, CA 91766 and is currently estimated at $878,868, approximately $537 per square foot. 45 Rising Hill Rd is a home located in Los Angeles County with nearby schools including Decker Elementary, Lorbeer Middle School, and Diamond Ranch High School.
Ownership History
Date
Name
Owned For
Owner Type
Purchase Details
Closed on
Sep 22, 2010
Sold by
Nguyen Ngon and Vuong Susie Tu Duy
Bought by
Lam Vu V and Lam Phong
Current Estimated Value
Home Financials for this Owner
Home Financials are based on the most recent Mortgage that was taken out on this home.
Original Mortgage
$316,761
Interest Rate
4.4%
Mortgage Type
FHA
Purchase Details
Closed on
May 4, 2005
Sold by
Wiese Jason
Bought by
Nguyen Ngon and Voung Susie Tu Duy
Home Financials for this Owner
Home Financials are based on the most recent Mortgage that was taken out on this home.
Original Mortgage
$445,500
Interest Rate
5.74%
Mortgage Type
Fannie Mae Freddie Mac
Purchase Details
Closed on
Jan 5, 2004
Sold by
Wiese Arlene
Bought by
Wiese Jason
Home Financials for this Owner
Home Financials are based on the most recent Mortgage that was taken out on this home.
Original Mortgage
$356,250
Interest Rate
6.35%
Mortgage Type
Purchase Money Mortgage
Create a Home Valuation Report for This Property
The Home Valuation Report is an in-depth analysis detailing your home's value as well as a comparison with similar homes in the area
Home Values in the Area
Average Home Value in this Area
Purchase History
| Date | Buyer | Sale Price | Title Company |
|---|---|---|---|
| Lam Vu V | $325,000 | Investors Title Company | |
| Nguyen Ngon | $495,000 | Ticor Title Co | |
| Wiese Jason | -- | First American Title Co Los | |
| Wiese Jason | $375,000 | Fatcola |
Source: Public Records
Mortgage History
| Date | Status | Borrower | Loan Amount |
|---|---|---|---|
| Previous Owner | Lam Vu V | $316,761 | |
| Previous Owner | Nguyen Ngon | $445,500 | |
| Previous Owner | Wiese Jason | $356,250 |
Source: Public Records
Tax History Compared to Growth
Tax History
| Year | Tax Paid | Tax Assessment Tax Assessment Total Assessment is a certain percentage of the fair market value that is determined by local assessors to be the total taxable value of land and additions on the property. | Land | Improvement |
|---|---|---|---|---|
| 2025 | $5,634 | $416,368 | $233,423 | $182,945 |
| 2024 | $5,634 | $408,205 | $228,847 | $179,358 |
| 2023 | $5,528 | $400,202 | $224,360 | $175,842 |
| 2022 | $5,447 | $392,356 | $219,961 | $172,395 |
| 2021 | $5,329 | $384,664 | $215,649 | $169,015 |
| 2020 | $5,313 | $380,720 | $213,438 | $167,282 |
| 2019 | $5,439 | $373,255 | $209,253 | $164,002 |
| 2018 | $5,020 | $365,937 | $205,150 | $160,787 |
| 2016 | $4,727 | $351,730 | $197,185 | $154,545 |
| 2015 | $4,689 | $346,448 | $194,224 | $152,224 |
| 2014 | $4,661 | $339,663 | $190,420 | $149,243 |
Source: Public Records
Map
Nearby Homes
- 11 Rising Hill Rd
- 26 Viewpoint Cir
- 19 Viewpoint Cir
- 981 Rodeo Rd
- 1748 S Huntington St
- 1626 Calatina Dr
- 984 Fremont St
- 1337 Clovis Ct
- 8 Vista Ct
- 6 Hunter Point Rd
- 23 Country Ridge Rd
- 35 Old Wood Rd
- 4 Turn Post Ln
- 15 Greensboro Ct
- 19 Black Oak Dr
- 1423 S Hamilton Blvd Unit 1425
- 1261 W Fernleaf Ave
- 49 Stagecoach Dr
- 1363 Buena Vista Ave
- 1425 S White Ave Unit A
- 43 Rising Hill Rd
- 47 Rising Hill Rd
- 41 Rising Hill Rd
- 49 Rising Hill Rd
- 39 Rising Hill Rd
- 16 Quiet Canyon Cir
- 8 Quiet Canyon Cir
- 51 Rising Hill Rd
- 18 Quiet Canyon Cir
- 37 Rising Hill Rd
- 46 Rising Hill Rd
- 48 Rising Hill Rd
- 44 Rising Hill Rd
- 50 Rising Hill Rd
- 42 Rising Hill Rd
- 35 Rising Hill Rd
- 40 Rising Hill Rd
- 52 Rising Hill Rd
- 20 Quiet Canyon Cir
- 38 Rising Hill Rd