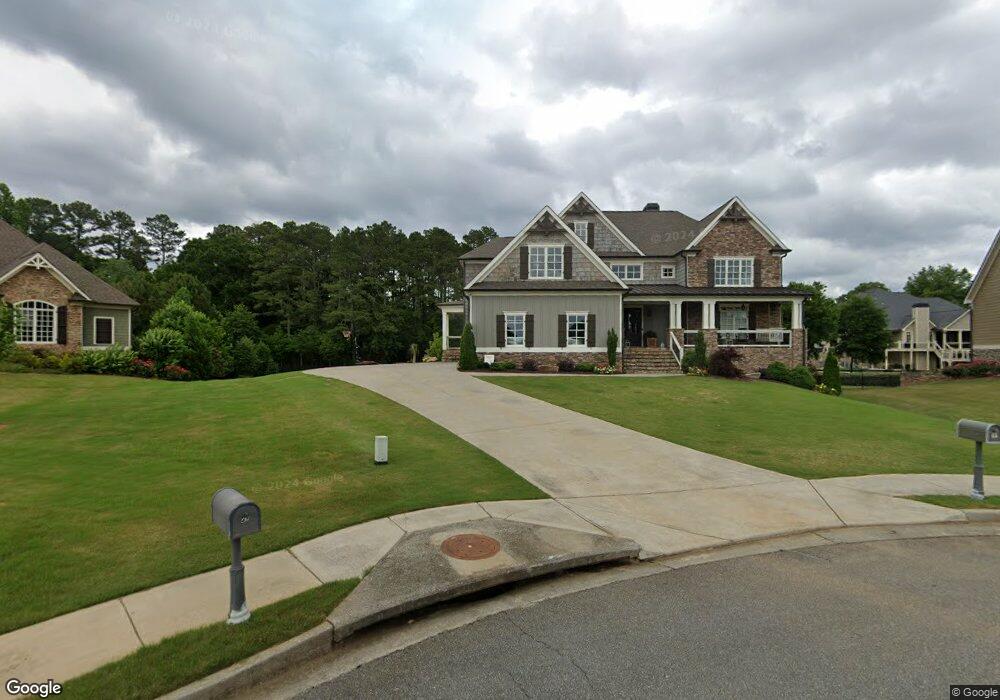
45 River Shoals Dr SE Cartersville, GA 30120
Estimated Value: $822,663 - $1,036,000
4
Beds
3
Baths
3,998
Sq Ft
$224/Sq Ft
Est. Value
About This Home
This home is located at 45 River Shoals Dr SE, Cartersville, GA 30120 and is currently estimated at $895,916, approximately $224 per square foot. 45 River Shoals Dr SE is a home with nearby schools including Cartersville Primary School, Cartersville Elementary School, and Cartersville Middle School.
Ownership History
Date
Name
Owned For
Owner Type
Purchase Details
Closed on
Oct 20, 2017
Bought by
Jones Mitchell T and Jones Kristen J
Current Estimated Value
Home Financials for this Owner
Home Financials are based on the most recent Mortgage that was taken out on this home.
Original Mortgage
$423,350
Outstanding Balance
$353,711
Interest Rate
3.83%
Mortgage Type
New Conventional
Estimated Equity
$542,205
Purchase Details
Closed on
Feb 22, 2017
Sold by
Jones Mitchell T
Bought by
Smith Built Contracting Llc
Purchase Details
Closed on
Jul 12, 2016
Sold by
Jones Mitchell T
Bought by
Jones Mitchell T and Jones Kristen N
Home Financials for this Owner
Home Financials are based on the most recent Mortgage that was taken out on this home.
Original Mortgage
$67,500
Interest Rate
3.54%
Mortgage Type
New Conventional
Purchase Details
Closed on
Sep 20, 2012
Sold by
Clark Wyatt D
Bought by
Ducaplex Llc
Purchase Details
Closed on
Sep 4, 2012
Sold by
Clark Wyatt D
Bought by
Ducaplex Llc
Create a Home Valuation Report for This Property
The Home Valuation Report is an in-depth analysis detailing your home's value as well as a comparison with similar homes in the area
Home Values in the Area
Average Home Value in this Area
Purchase History
| Date | Buyer | Sale Price | Title Company |
|---|---|---|---|
| Jones Mitchell T | $498,149 | -- | |
| Smith Built Contracting Llc | $65,420 | -- | |
| Jones Mitchell T | -- | -- | |
| Jones Mitchell T | $75,000 | -- | |
| Ducaplex Llc | $37,501 | -- | |
| Ducaplex Llc | $37,501 | -- |
Source: Public Records
Mortgage History
| Date | Status | Borrower | Loan Amount |
|---|---|---|---|
| Open | Jones Mitchell T | $423,350 | |
| Previous Owner | Jones Mitchell T | $67,500 |
Source: Public Records
Tax History Compared to Growth
Tax History
| Year | Tax Paid | Tax Assessment Tax Assessment Total Assessment is a certain percentage of the fair market value that is determined by local assessors to be the total taxable value of land and additions on the property. | Land | Improvement |
|---|---|---|---|---|
| 2024 | $8,583 | $345,373 | $58,000 | $287,373 |
| 2023 | $8,583 | $313,005 | $54,000 | $259,005 |
| 2022 | $7,187 | $275,322 | $50,000 | $225,322 |
| 2021 | $5,273 | $197,646 | $28,000 | $169,646 |
| 2020 | $5,527 | $197,646 | $28,000 | $169,646 |
| 2019 | $5,630 | $195,933 | $28,000 | $167,933 |
| 2018 | $5,819 | $204,260 | $28,000 | $176,260 |
| 2017 | $477 | $16,000 | $16,000 | $0 |
| 2016 | $388 | $12,800 | $12,800 | $0 |
| 2015 | $318 | $10,720 | $10,720 | $0 |
| 2014 | -- | $8,040 | $8,040 | $0 |
| 2013 | -- | $3,750 | $3,750 | $0 |
Source: Public Records
Map
Nearby Homes
- 44 River Shoals Dr SE
- 11 Laurel Trace SE
- 0 Old Alabama Rd SE Unit 7652936
- 0 Old Alabama Rd SE Unit 10609115
- 11 Hampton Ln
- 34 Bridgestone Way
- 6 Devon Ct
- 28 Bridgestone Way
- 25 Westchester Dr
- 29 Creekview Dr
- 12 Bridgestone Way SE
- 16 Creekview Dr SE
- 10 Buckingham Ct
- Magnolia Plan at Carter Grove - Georgian Series
- Hampton Plan at Carter Grove - Executive Series
- Axley Plan at Carter Grove - Georgian Series
- Alexander Plan at Carter Grove - Executive Series
- 8 Lakewood Ct
- 10 Lakewood Ct
- 41 Aspen Ln SE
- 10 Creekstone Ct SE
- 47 River Shoals Dr SE
- 43 River Shoals Dr SE
- 8 Creekstone Ct SE
- 8 Creekstone Ct
- 48 River Shoals Dr SE
- 41 River Shoals Dr SE
- 46 River Shoals Dr SE
- 44 River Shoals Dr
- 6 Creekstone Ct SE
- 9 Creekstone Ct SE
- 39 River Shoals Dr SE
- 7 Creekstone Ct SE
- 4 Creekstone Ct
- 0 Creekstone Ct Unit 8574147
- 0 Creekstone Ct Unit 8101103
- 40 River Shoals Dr SE
- 5 Creekstone Ct SE
- 37 River Shoals Dr SE
- 3 Creekstone Ct