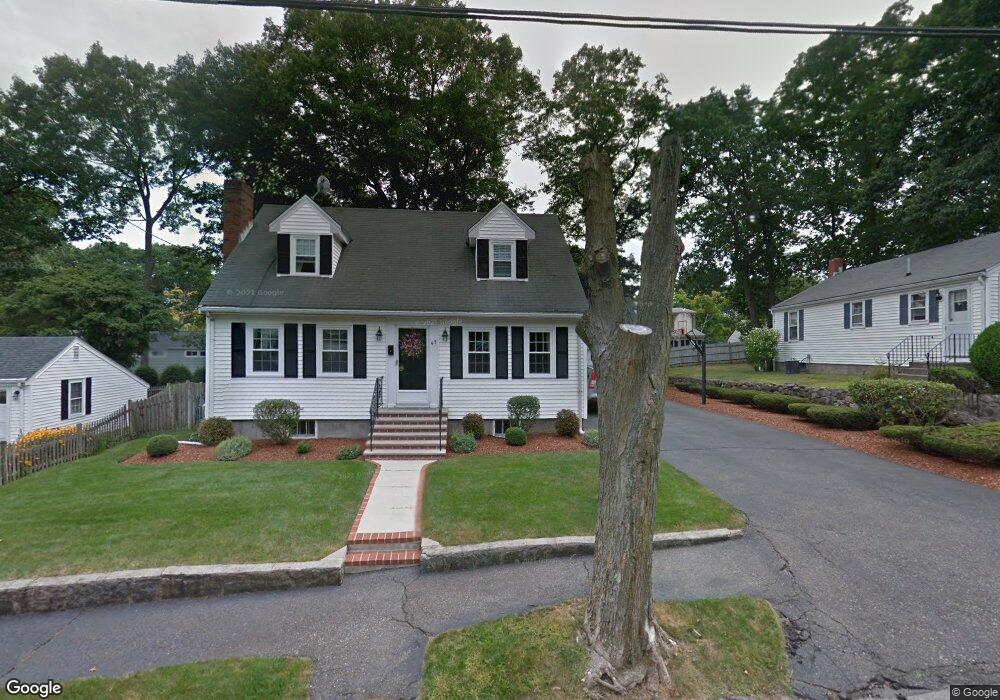
45 Rose St Milton, MA 02186
Estimated Value: $1,279,000 - $1,420,000
4
Beds
3
Baths
2,679
Sq Ft
$494/Sq Ft
Est. Value
About This Home
This home is located at 45 Rose St, Milton, MA 02186 and is currently estimated at $1,323,013, approximately $493 per square foot. 45 Rose St is a home located in Norfolk County with nearby schools including Milton High School, St. Agatha School, and Milton Academy.
Ownership History
Date
Name
Owned For
Owner Type
Purchase Details
Closed on
Feb 28, 2021
Sold by
Henderson Carol A and Hallisey Kristin H
Bought by
Henderson Carol A and Hallisey Kristin H
Current Estimated Value
Purchase Details
Closed on
Mar 22, 2017
Sold by
Henderson Carol A
Bought by
Henderson Carol A and Hallisey Kristin H
Purchase Details
Closed on
Jun 1, 1979
Bought by
Henderson Robert D and Henderson Carol A
Create a Home Valuation Report for This Property
The Home Valuation Report is an in-depth analysis detailing your home's value as well as a comparison with similar homes in the area
Purchase History
| Date | Buyer | Sale Price | Title Company |
|---|---|---|---|
| Henderson Carol A | -- | None Available | |
| Henderson Carol A | -- | -- | |
| Henderson Robert D | -- | -- |
Source: Public Records
Mortgage History
| Date | Status | Borrower | Loan Amount |
|---|---|---|---|
| Previous Owner | Henderson Robert D | $175,000 | |
| Previous Owner | Henderson Robert D | $15,000 | |
| Previous Owner | Henderson Robert D | $136,500 | |
| Previous Owner | Henderson Robert D | $140,000 |
Source: Public Records
Tax History
| Year | Tax Paid | Tax Assessment Tax Assessment Total Assessment is a certain percentage of the fair market value that is determined by local assessors to be the total taxable value of land and additions on the property. | Land | Improvement |
|---|---|---|---|---|
| 2025 | $11,598 | $1,045,800 | $511,800 | $534,000 |
| 2024 | $11,273 | $1,032,300 | $487,400 | $544,900 |
| 2023 | $11,272 | $988,800 | $464,300 | $524,500 |
| 2022 | $10,878 | $872,300 | $464,300 | $408,000 |
| 2021 | $9,981 | $760,200 | $371,700 | $388,500 |
| 2020 | $9,923 | $756,300 | $356,100 | $400,200 |
| 2019 | $9,608 | $729,000 | $345,700 | $383,300 |
| 2018 | $7,652 | $554,100 | $301,900 | $252,200 |
| 2017 | $7,157 | $527,800 | $287,500 | $240,300 |
| 2016 | $6,687 | $495,300 | $260,100 | $235,200 |
| 2015 | $6,538 | $469,000 | $239,600 | $229,400 |
Source: Public Records
Map
Nearby Homes
- 40 Dean Rd
- 207 Pleasant St
- 111-113 Pleasant St
- 97 Pleasant St
- 403405 Reedsdale Rd
- 46 Century Ln
- 1185 Brook Rd
- 84 Gardiner Rd
- 6 Brewster Rd
- 397 Adams St
- 400 Adams St Unit A
- 260 Canton Ave
- 440 Granite Ave Unit 201
- 161 Sassamon Ave
- 85 Forbes Rd
- 114 Willard St Unit 4
- 52 California Ave
- 41 Wallace Rd
- 230 Willard St Unit 102
- 424 Brook Rd
Your Personal Tour Guide
Ask me questions while you tour the home.