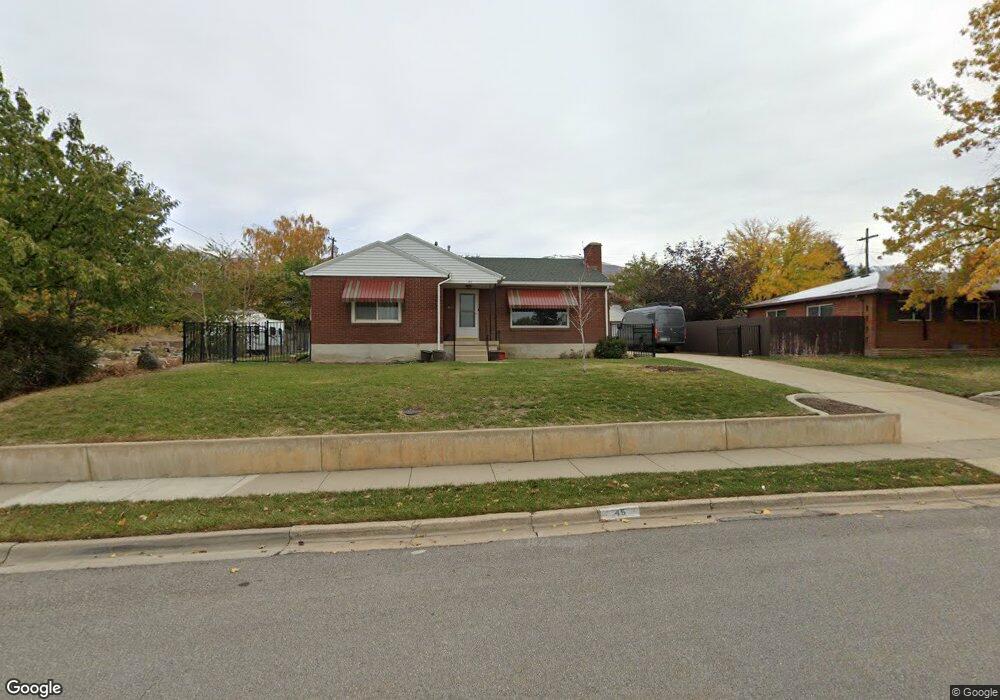
45 S 600 E Bountiful, UT 84010
Estimated Value: $519,000 - $621,000
4
Beds
2
Baths
2,456
Sq Ft
$231/Sq Ft
Est. Value
About This Home
This home is located at 45 S 600 E, Bountiful, UT 84010 and is currently estimated at $567,103, approximately $230 per square foot. 45 S 600 E is a home located in Davis County with nearby schools including Holbrook Elementary School, Millcreek Junior High School, and Bountiful High School.
Ownership History
Date
Name
Owned For
Owner Type
Purchase Details
Closed on
Jul 10, 2023
Sold by
Sbraga Michelle P
Bought by
Silver Michael Paul and Silver Melissa Mcdonough
Current Estimated Value
Home Financials for this Owner
Home Financials are based on the most recent Mortgage that was taken out on this home.
Original Mortgage
$460,000
Outstanding Balance
$448,572
Interest Rate
6.79%
Mortgage Type
New Conventional
Estimated Equity
$118,531
Purchase Details
Closed on
Oct 5, 2022
Sold by
Carlisle Michael B
Bought by
Sbraga Michelle P
Purchase Details
Closed on
Oct 26, 2017
Sold by
Francis Howard Kent
Bought by
Carlisle Michael B and Carlisle Michelle P
Home Financials for this Owner
Home Financials are based on the most recent Mortgage that was taken out on this home.
Original Mortgage
$210,000
Interest Rate
3.78%
Mortgage Type
New Conventional
Create a Home Valuation Report for This Property
The Home Valuation Report is an in-depth analysis detailing your home's value as well as a comparison with similar homes in the area
Purchase History
| Date | Buyer | Sale Price | Title Company |
|---|---|---|---|
| Silver Michael Paul | -- | Aspen Title | |
| Sbraga Michelle P | -- | -- | |
| Carlisle Michael B | -- | First American Title |
Source: Public Records
Mortgage History
| Date | Status | Borrower | Loan Amount |
|---|---|---|---|
| Open | Silver Michael Paul | $460,000 | |
| Previous Owner | Carlisle Michael B | $210,000 |
Source: Public Records
Tax History
| Year | Tax Paid | Tax Assessment Tax Assessment Total Assessment is a certain percentage of the fair market value that is determined by local assessors to be the total taxable value of land and additions on the property. | Land | Improvement |
|---|---|---|---|---|
| 2025 | $3,093 | $276,651 | $145,250 | $131,401 |
| 2024 | $2,914 | $270,600 | $133,737 | $136,863 |
| 2023 | $2,607 | $437,000 | $244,889 | $192,111 |
| 2022 | $2,611 | $239,800 | $130,737 | $109,063 |
| 2021 | $2,368 | $333,000 | $194,518 | $138,482 |
| 2020 | $2,098 | $295,000 | $177,066 | $117,934 |
| 2019 | $2,097 | $288,000 | $169,123 | $118,877 |
| 2018 | $1,945 | $262,000 | $157,816 | $104,184 |
| 2016 | $1,726 | $126,225 | $52,556 | $73,669 |
| 2015 | $1,697 | $117,095 | $52,556 | $64,539 |
| 2014 | $1,721 | $122,847 | $52,556 | $70,291 |
| 2013 | -- | $113,761 | $52,579 | $61,182 |
Source: Public Records
Map
Nearby Homes
- 683 E 100 N
- 6 N 800 E
- 129 N 800 E
- 456 E 500 S
- 520 S Orchard Dr Unit 17
- 255 E 400 S
- 275 E Peach Ln S
- 453 N 400 E Unit 7-D
- 513 N 400 E Unit 14B
- 323 Peach Ln
- 357 S 100 E
- 1138 Briggs Dr
- 49 E 200 N Unit 4
- 41 E 200 N Unit 6
- 55 E 200 N Unit 2
- 51 E 200 N Unit 3
- 545 S 100 E
- 254 N Main St
- 256 N Main St
- 252 N Main St
Your Personal Tour Guide
Ask me questions while you tour the home.