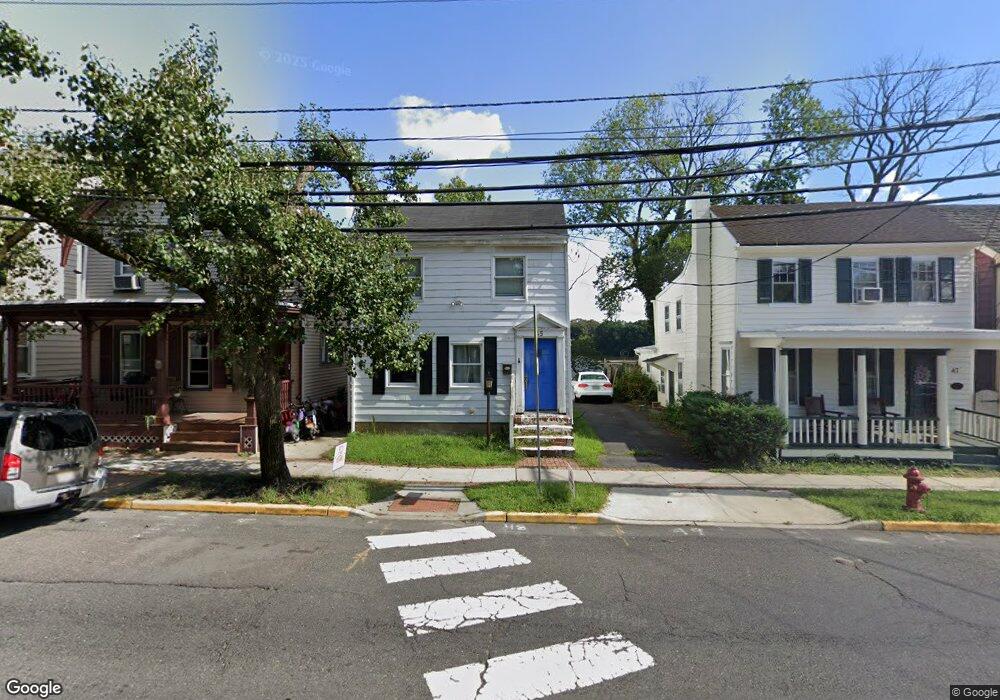
45 S Main St Allentown, NJ 08501
Estimated Value: $230,000 - $500,000
2
Beds
1
Bath
1,530
Sq Ft
$245/Sq Ft
Est. Value
About This Home
This home is located at 45 S Main St, Allentown, NJ 08501 and is currently estimated at $374,245, approximately $244 per square foot. 45 S Main St is a home located in Monmouth County with nearby schools including Newell Elementary School, Stonebridge Middle School, and Allentown High School.
Ownership History
Date
Name
Owned For
Owner Type
Purchase Details
Closed on
Jun 30, 2023
Sold by
Rgc Enterprises Llc
Bought by
Russo Croce
Current Estimated Value
Purchase Details
Closed on
Feb 7, 2011
Sold by
Rudin Charles A
Bought by
Rgc Enterprises Llc
Purchase Details
Closed on
Feb 2, 2010
Sold by
Queenan Thomas and Rudin Charles A
Bought by
Rudin Charles A
Purchase Details
Closed on
May 19, 2003
Sold by
Hunter Denise
Bought by
Hunter William
Create a Home Valuation Report for This Property
The Home Valuation Report is an in-depth analysis detailing your home's value as well as a comparison with similar homes in the area
Home Values in the Area
Average Home Value in this Area
Purchase History
| Date | Buyer | Sale Price | Title Company |
|---|---|---|---|
| Russo Croce | -- | None Listed On Document | |
| Russo Croce | -- | None Listed On Document | |
| Rgc Enterprises Llc | $160,000 | First American Title Ins Co | |
| Rudin Charles A | -- | None Available | |
| Hunter William | $44,000 | -- |
Source: Public Records
Tax History Compared to Growth
Tax History
| Year | Tax Paid | Tax Assessment Tax Assessment Total Assessment is a certain percentage of the fair market value that is determined by local assessors to be the total taxable value of land and additions on the property. | Land | Improvement |
|---|---|---|---|---|
| 2025 | $3,604 | $112,000 | $105,400 | $6,600 |
| 2024 | $3,223 | $112,000 | $105,400 | $6,600 |
| 2023 | $3,223 | $112,000 | $105,400 | $6,600 |
| 2022 | $3,365 | $112,000 | $105,400 | $6,600 |
| 2021 | $3,365 | $112,000 | $105,400 | $6,600 |
| 2020 | $3,305 | $112,000 | $105,400 | $6,600 |
| 2019 | $3,392 | $112,000 | $105,400 | $6,600 |
| 2018 | $3,412 | $112,000 | $105,400 | $6,600 |
| 2017 | $3,414 | $112,000 | $105,400 | $6,600 |
| 2016 | $3,407 | $112,000 | $105,400 | $6,600 |
| 2015 | $5,339 | $188,600 | $105,400 | $83,200 |
| 2014 | $3,147 | $112,100 | $90,000 | $22,100 |
Source: Public Records
Map
Nearby Homes
- 35 Church St
- 3 Johnson Dr
- 8 Coates Rd
- 11 Probasco Dr
- 30 Ridgeview Way
- 164 Ellisdale Rd
- 33 Bunker Hill Dr
- 40 Bunker Hill Dr
- 10 Powderhorn Way
- 81 Potts Rd
- 45 Circle Dr
- 79 Potts Rd
- 9 Woodfield Ln
- 3 Dartmouth Ct
- 7 Corral Dr
- 9 Meetinghouse Rd
- STONEHAVEN II Plan at Old York Estates
- 5 Meetinghouse Rd
- 41 Gina Dr
- 467 Gordon Rd