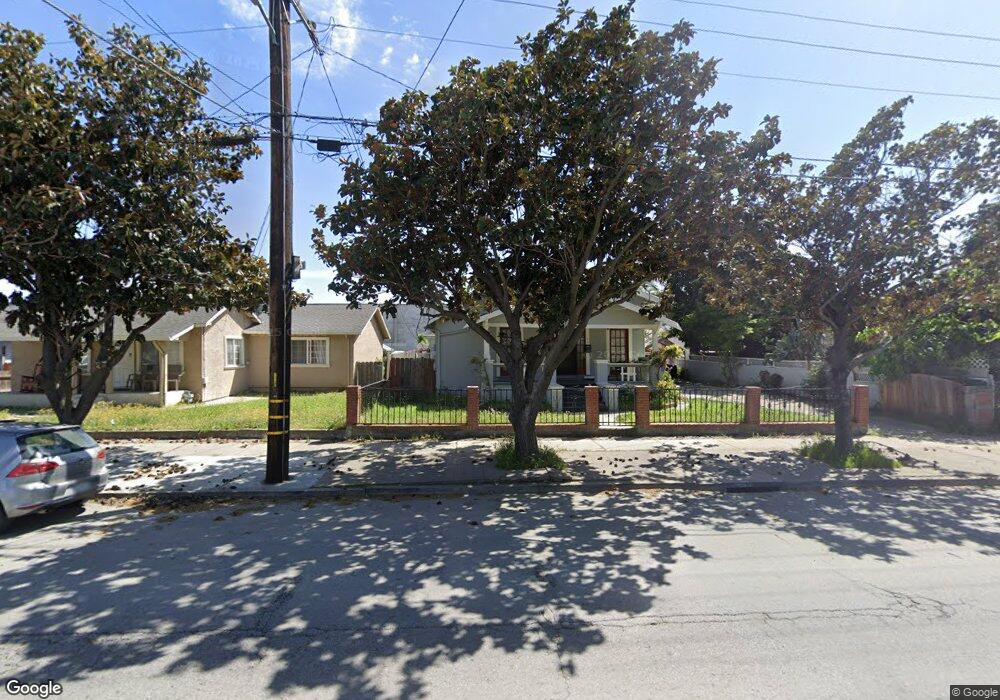
45 South St Hollister, CA 95023
Estimated Value: $515,000 - $629,620
3
Beds
1
Bath
1,197
Sq Ft
$498/Sq Ft
Est. Value
About This Home
This home is located at 45 South St, Hollister, CA 95023 and is currently estimated at $596,405, approximately $498 per square foot. 45 South St is a home located in San Benito County with nearby schools including Ladd Lane Elementary School, Rancho San Justo School, and San Benito High School.
Ownership History
Date
Name
Owned For
Owner Type
Purchase Details
Closed on
Jun 20, 2019
Sold by
Ornelas Roberto
Bought by
Ornelas Leticia Magana
Current Estimated Value
Home Financials for this Owner
Home Financials are based on the most recent Mortgage that was taken out on this home.
Original Mortgage
$244,000
Outstanding Balance
$214,536
Interest Rate
4.1%
Mortgage Type
New Conventional
Estimated Equity
$381,869
Purchase Details
Closed on
Apr 27, 2017
Sold by
Ornelas Juanita
Bought by
Ornelas Juanita Bravo and Ornelas Roberto
Purchase Details
Closed on
Feb 13, 2013
Sold by
Ornelas Juanita
Bought by
Ornelas Juanita
Purchase Details
Closed on
Dec 6, 2006
Sold by
Ornelas Juanita
Bought by
Ornelas Juanita
Create a Home Valuation Report for This Property
The Home Valuation Report is an in-depth analysis detailing your home's value as well as a comparison with similar homes in the area
Home Values in the Area
Average Home Value in this Area
Purchase History
| Date | Buyer | Sale Price | Title Company |
|---|---|---|---|
| Ornelas Leticia Magana | -- | Old Republic Title Company | |
| Magana Efrain F | $305,000 | Old Republic Title Company | |
| Ornelas Juanita Bravo | -- | None Available | |
| Ornelas Juanita | -- | None Available | |
| Ornelas Juanita | -- | None Available |
Source: Public Records
Mortgage History
| Date | Status | Borrower | Loan Amount |
|---|---|---|---|
| Open | Magana Efrain F | $244,000 |
Source: Public Records
Tax History Compared to Growth
Tax History
| Year | Tax Paid | Tax Assessment Tax Assessment Total Assessment is a certain percentage of the fair market value that is determined by local assessors to be the total taxable value of land and additions on the property. | Land | Improvement |
|---|---|---|---|---|
| 2025 | $6,144 | $488,525 | $211,946 | $276,579 |
| 2023 | $6,144 | $482,488 | $203,717 | $278,771 |
| 2022 | $5,949 | $473,028 | $199,723 | $273,305 |
| 2021 | $5,868 | $463,754 | $195,807 | $267,947 |
| 2020 | $5,892 | $459,000 | $193,800 | $265,200 |
| 2019 | $1,393 | $109,444 | $29,837 | $79,607 |
| 2018 | $1,360 | $107,299 | $29,252 | $78,047 |
| 2017 | $1,343 | $105,196 | $28,679 | $76,517 |
| 2016 | $1,255 | $103,134 | $28,117 | $75,017 |
| 2015 | $1,243 | $101,586 | $27,695 | $73,891 |
| 2014 | $1,170 | $99,597 | $27,153 | $72,444 |
Source: Public Records
Map
Nearby Homes
- 211 6th St
- 375 South St
- 895 Monterey St
- 345 6th St
- 202 5th St
- 441 Adrian Ct
- 435 San Benito St
- 1001 Monterey St
- 400 San Benito St Unit 202
- 400 San Benito St Unit 304
- 400 San Benito St Unit 312
- 400 San Benito St Unit 309
- 400 San Benito St Unit 308
- 400 San Benito St Unit 212
- 1010 Monterey St
- 220 4th St
- 1179 San Benito St
- 1218 Sally St
- 921 Suiter St
- 160 Gibson Dr Unit 20