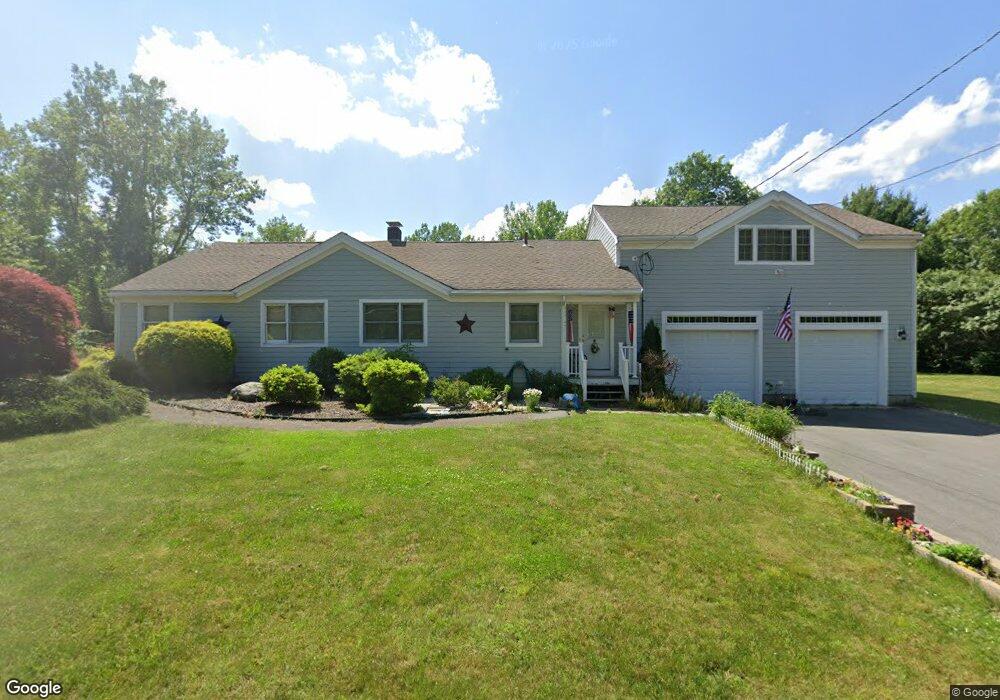
45 Spring St Walpole, MA 02081
Estimated Value: $656,000 - $831,000
3
Beds
2
Baths
1,408
Sq Ft
$546/Sq Ft
Est. Value
About This Home
This home is located at 45 Spring St, Walpole, MA 02081 and is currently estimated at $768,717, approximately $545 per square foot. 45 Spring St is a home located in Norfolk County with nearby schools including Elm Street School, Eleanor N. Johnson Middle School, and Walpole High School.
Ownership History
Date
Name
Owned For
Owner Type
Purchase Details
Closed on
Sep 8, 2006
Sold by
Fisher Tracy A
Bought by
Taglienti Keith J
Current Estimated Value
Purchase Details
Closed on
Apr 17, 2001
Sold by
Frank Steven D and Frank Courtney A
Bought by
Fisher Tracy A
Home Financials for this Owner
Home Financials are based on the most recent Mortgage that was taken out on this home.
Original Mortgage
$236,000
Interest Rate
6.97%
Mortgage Type
Purchase Money Mortgage
Purchase Details
Closed on
Aug 29, 1997
Sold by
Walpole Homes Lp
Bought by
D & J Rt
Home Financials for this Owner
Home Financials are based on the most recent Mortgage that was taken out on this home.
Original Mortgage
$20,000
Interest Rate
7.47%
Purchase Details
Closed on
Jun 23, 1995
Sold by
Walpole Homes Lp
Bought by
Frank Steven D and Frank Michele
Home Financials for this Owner
Home Financials are based on the most recent Mortgage that was taken out on this home.
Original Mortgage
$116,000
Interest Rate
7.82%
Mortgage Type
Purchase Money Mortgage
Create a Home Valuation Report for This Property
The Home Valuation Report is an in-depth analysis detailing your home's value as well as a comparison with similar homes in the area
Home Values in the Area
Average Home Value in this Area
Purchase History
| Date | Buyer | Sale Price | Title Company |
|---|---|---|---|
| Taglienti Keith J | $415,000 | -- | |
| Fisher Tracy A | $296,000 | -- | |
| D & J Rt | $20,500 | -- | |
| Frank Steven D | $145,000 | -- |
Source: Public Records
Mortgage History
| Date | Status | Borrower | Loan Amount |
|---|---|---|---|
| Previous Owner | Frank Steven D | $236,000 | |
| Previous Owner | Frank Steven D | $184,450 | |
| Previous Owner | Frank Steven D | $20,000 | |
| Previous Owner | Frank Steven D | $116,000 |
Source: Public Records
Tax History
| Year | Tax Paid | Tax Assessment Tax Assessment Total Assessment is a certain percentage of the fair market value that is determined by local assessors to be the total taxable value of land and additions on the property. | Land | Improvement |
|---|---|---|---|---|
| 2025 | $9,168 | $714,600 | $297,700 | $416,900 |
| 2024 | $8,790 | $664,900 | $286,200 | $378,700 |
| 2023 | $8,401 | $604,800 | $249,000 | $355,800 |
| 2022 | $7,924 | $548,000 | $230,500 | $317,500 |
| 2021 | $7,680 | $517,500 | $217,500 | $300,000 |
| 2020 | $7,387 | $492,800 | $205,200 | $287,600 |
| 2019 | $7,250 | $480,100 | $197,200 | $282,900 |
| 2018 | $6,926 | $453,600 | $189,700 | $263,900 |
| 2017 | $6,210 | $405,100 | $182,500 | $222,600 |
| 2016 | $5,085 | $326,800 | $168,400 | $158,400 |
| 2015 | $4,955 | $315,600 | $160,300 | $155,300 |
| 2014 | $4,704 | $298,500 | $160,300 | $138,200 |
Source: Public Records
Map
Nearby Homes
- 1110 Main St
- 50 Riverside Place
- 224 School St Unit 9
- 222 School St Unit 9
- 145 South St Unit 5
- 881 Main St Unit 9
- 260 Elm St
- 1391 Main St Unit 308
- 1391 Main St Unit 306
- 1391 Main St Unit 304
- 31 Sandtrap Cir Unit 500
- 10 Sandtrap Cir Unit 2
- 13 Sandtrap Cir Unit 14
- 11 Sandtrap Cir Unit 15
- 20 Sandtrap Cir Unit 4
- 19 Sandtrap Cir Unit 11
- 18 Sandtrap Cir Unit 3
- 17 Sandtrap Cir Unit 12
- 15 Sandtrap Cir Unit 13
- 20 Forrest Rd
- 51 Spring St Unit 51
- 49 Spring St Unit 51
- 46 Riverview Place
- 25 Spring St
- 44 Riverview Place
- 42 Riverview Place
- 42 Riverview Place Unit 1
- 42 Riverview Place Unit 44
- 42 Riverview Place Unit 42
- 53 Spring St
- 30 Riverview Place Unit 32
- 25 Mallard Ln
- 26 Mallard Ln
- 28 Mallard Ln
- 27 Mallard Ln
- 27 Mallard Ln Unit 27,27
- 50 Spring St Unit 52
- 52 Spring St Unit 52
- 19 Mallard Ln
- 20 Mallard Ln
Your Personal Tour Guide
Ask me questions while you tour the home.