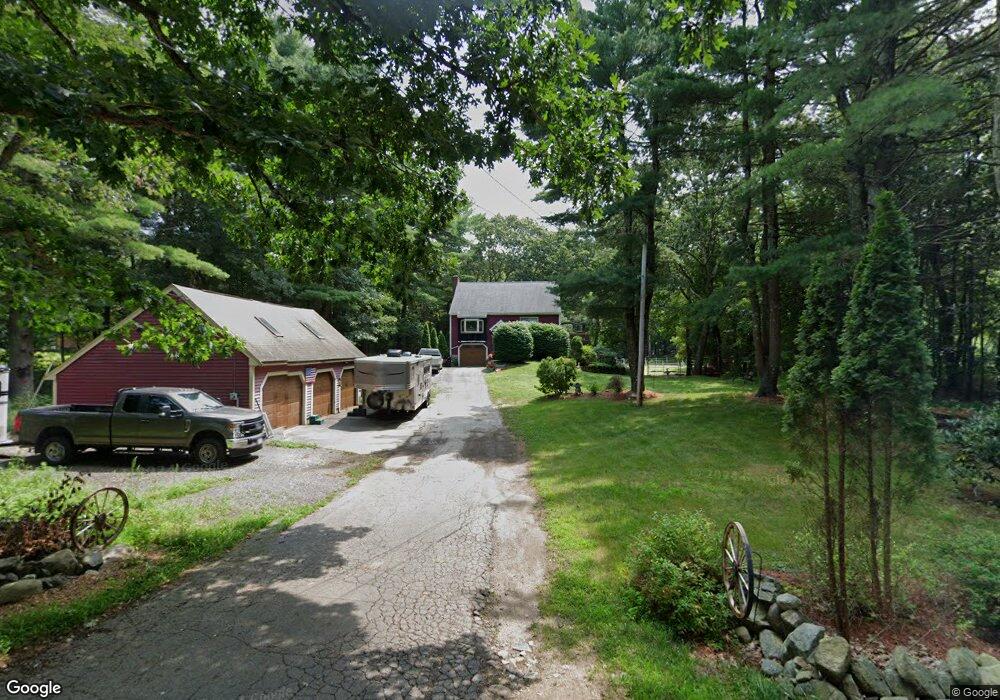
45 Spring St Wrentham, MA 02093
West Wrentham NeighborhoodEstimated Value: $709,000 - $765,000
3
Beds
2
Baths
1,800
Sq Ft
$410/Sq Ft
Est. Value
About This Home
This home is located at 45 Spring St, Wrentham, MA 02093 and is currently estimated at $738,191, approximately $410 per square foot. 45 Spring St is a home located in Norfolk County with nearby schools including Delaney Elementary School, Charles E Roderick, and Mercymount Country Day School.
Ownership History
Date
Name
Owned For
Owner Type
Purchase Details
Closed on
Mar 29, 2007
Sold by
Christopher Jallen Irt
Bought by
Fallon James and Grant Julie L
Current Estimated Value
Home Financials for this Owner
Home Financials are based on the most recent Mortgage that was taken out on this home.
Original Mortgage
$315,000
Outstanding Balance
$192,336
Interest Rate
6.33%
Mortgage Type
Purchase Money Mortgage
Estimated Equity
$545,855
Purchase Details
Closed on
Sep 21, 1995
Sold by
Guay Russell B and Guay Robin A
Bought by
Allen Tr John L and Allen Catherine E
Home Financials for this Owner
Home Financials are based on the most recent Mortgage that was taken out on this home.
Original Mortgage
$80,000
Interest Rate
7.81%
Mortgage Type
Purchase Money Mortgage
Create a Home Valuation Report for This Property
The Home Valuation Report is an in-depth analysis detailing your home's value as well as a comparison with similar homes in the area
Home Values in the Area
Average Home Value in this Area
Purchase History
| Date | Buyer | Sale Price | Title Company |
|---|---|---|---|
| Fallon James | $430,000 | -- | |
| Allen Tr John L | $203,500 | -- |
Source: Public Records
Mortgage History
| Date | Status | Borrower | Loan Amount |
|---|---|---|---|
| Open | Fallon James | $315,000 | |
| Previous Owner | Allen Tr John L | $80,000 |
Source: Public Records
Tax History
| Year | Tax Paid | Tax Assessment Tax Assessment Total Assessment is a certain percentage of the fair market value that is determined by local assessors to be the total taxable value of land and additions on the property. | Land | Improvement |
|---|---|---|---|---|
| 2025 | $7,576 | $653,700 | $288,300 | $365,400 |
| 2024 | $7,398 | $616,500 | $288,300 | $328,200 |
| 2023 | $7,119 | $564,100 | $262,200 | $301,900 |
| 2022 | $7,490 | $547,900 | $255,400 | $292,500 |
| 2021 | $6,351 | $451,400 | $238,700 | $212,700 |
| 2020 | $5,774 | $405,200 | $182,300 | $222,900 |
| 2019 | $5,597 | $396,400 | $182,300 | $214,100 |
| 2018 | $5,801 | $407,400 | $182,100 | $225,300 |
| 2017 | $5,707 | $400,500 | $178,500 | $222,000 |
| 2016 | $5,585 | $391,100 | $173,400 | $217,700 |
| 2015 | $5,468 | $365,000 | $166,700 | $198,300 |
| 2014 | $5,499 | $359,200 | $160,300 | $198,900 |
Source: Public Records
Map
Nearby Homes
- 10 Follett Dr
- 9 Reagan Ave
- 1620 West St
- 60 Grant Ave
- 1565 West St
- 900 Washington St Lot 2
- 25 Nature View Dr
- 20 Nature View Dr
- 925 Washington St
- 365 W Wrentham Rd
- 180 Pine Swamp Rd
- 56 Pine Swamp Rd
- 9 Pebble Cir Unit 9
- 9 Brookfield Ln
- 65 Palmetto Dr Unit 65
- 21 Palmetto Dr Unit 21
- 24 Palmetto Dr Unit 24
- 18 Bubbling Brook Rd
- 47 Austin Dr
- 4 Carnation St
Your Personal Tour Guide
Ask me questions while you tour the home.