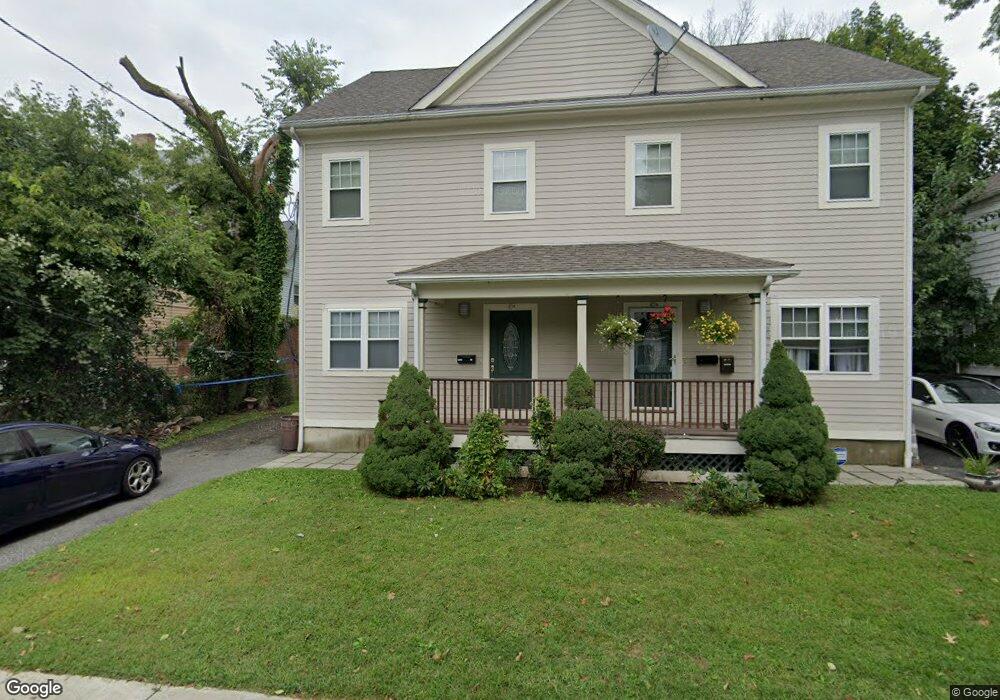
45 Temple St Unit B Mattapan, MA 02126
West Codman Hill-West Lowe NeighborhoodEstimated Value: $579,000 - $726,000
3
Beds
3
Baths
1,469
Sq Ft
$445/Sq Ft
Est. Value
About This Home
This home is located at 45 Temple St Unit B, Mattapan, MA 02126 and is currently estimated at $653,687, approximately $444 per square foot. 45 Temple St Unit B is a home located in Suffolk County with nearby schools including Conservatory Lab Upper School, Saint John Paul II Catholic Academy, and Epiphany School.
Ownership History
Date
Name
Owned For
Owner Type
Purchase Details
Closed on
Dec 11, 2019
Sold by
Nsp Residential Llc
Bought by
Watson Jacqueline and Offutt James K
Current Estimated Value
Home Financials for this Owner
Home Financials are based on the most recent Mortgage that was taken out on this home.
Original Mortgage
$524,000
Outstanding Balance
$462,884
Interest Rate
3.7%
Mortgage Type
New Conventional
Estimated Equity
$190,803
Purchase Details
Closed on
Nov 27, 2019
Sold by
Offutt Watson
Bought by
Nsp Residential Llc
Home Financials for this Owner
Home Financials are based on the most recent Mortgage that was taken out on this home.
Original Mortgage
$524,000
Outstanding Balance
$462,884
Interest Rate
3.7%
Mortgage Type
New Conventional
Estimated Equity
$190,803
Purchase Details
Closed on
Jan 31, 2006
Sold by
Temple 45 Rt
Bought by
Watson-Offutt Jacqueline
Home Financials for this Owner
Home Financials are based on the most recent Mortgage that was taken out on this home.
Original Mortgage
$343,800
Interest Rate
6.34%
Mortgage Type
Purchase Money Mortgage
Create a Home Valuation Report for This Property
The Home Valuation Report is an in-depth analysis detailing your home's value as well as a comparison with similar homes in the area
Home Values in the Area
Average Home Value in this Area
Purchase History
| Date | Buyer | Sale Price | Title Company |
|---|---|---|---|
| Watson Jacqueline | $526,740 | None Available | |
| Nsp Residential Llc | $430,000 | -- | |
| Watson-Offutt Jacqueline | $365,000 | -- |
Source: Public Records
Mortgage History
| Date | Status | Borrower | Loan Amount |
|---|---|---|---|
| Open | Watson Jacqueline | $524,000 | |
| Previous Owner | Watson-Offutt Jacqueline | $343,800 |
Source: Public Records
Tax History
| Year | Tax Paid | Tax Assessment Tax Assessment Total Assessment is a certain percentage of the fair market value that is determined by local assessors to be the total taxable value of land and additions on the property. | Land | Improvement |
|---|---|---|---|---|
| 2025 | $6,729 | $581,100 | $0 | $581,100 |
| 2024 | $5,999 | $550,400 | $0 | $550,400 |
| 2023 | $5,623 | $523,600 | $0 | $523,600 |
| 2022 | $5,153 | $473,600 | $0 | $473,600 |
| 2021 | $4,906 | $459,800 | $0 | $459,800 |
| 2020 | $4,028 | $381,400 | $0 | $381,400 |
| 2019 | $3,957 | $375,400 | $0 | $375,400 |
| 2018 | $3,746 | $357,400 | $0 | $357,400 |
| 2017 | $3,638 | $343,500 | $0 | $343,500 |
| 2016 | $3,467 | $315,200 | $0 | $315,200 |
| 2015 | $3,042 | $251,200 | $0 | $251,200 |
| 2014 | $3,009 | $239,200 | $0 | $239,200 |
Source: Public Records
Map
Nearby Homes
- 32-32R Temple St
- 14 Avondale St
- 67 Idaho St
- 1241-1255 Adams St Unit F213
- 1241-1255 Adams St Unit B302
- 1245 Adams St Unit B503
- 30 Pleasant Hill Ave Unit 32
- 36 Central Ave Unit 4
- 23 Maryknoll St
- 14 Valley Rd
- 88 Wharf St Unit 105
- 56 Fairmount St Unit 2
- 2089 Dorchester Ave Unit 1
- 20 Fairmount St
- 57 Fairmount St Unit A
- 2 Ogden St Unit 1
- 27-29 Brookvale St
- 988 Morton St
- 64 Stockton St
- 99 Capen St
- 45 Temple St Unit 507
- 45 Temple St Unit 509
- 45 Temple St
- 41 Temple St
- 32 Sanford St
- 30 Sanford St Unit 1
- 28 Sanford St Unit 1
- 28 Sanford St
- 42 Temple St
- 37 Temple St
- 35 Old Morton St
- 35 Old Morton St Unit 2
- 37-39 Old Morton St
- 39 Old Morton St Unit 2
- 37 Old Morton St
- 37 Old Morton St Unit 2
- 39 Old Morton St Unit 1
- 37 Old Morton St Unit 1
- 48 Temple St
- 41 Old Morton St
Your Personal Tour Guide
Ask me questions while you tour the home.