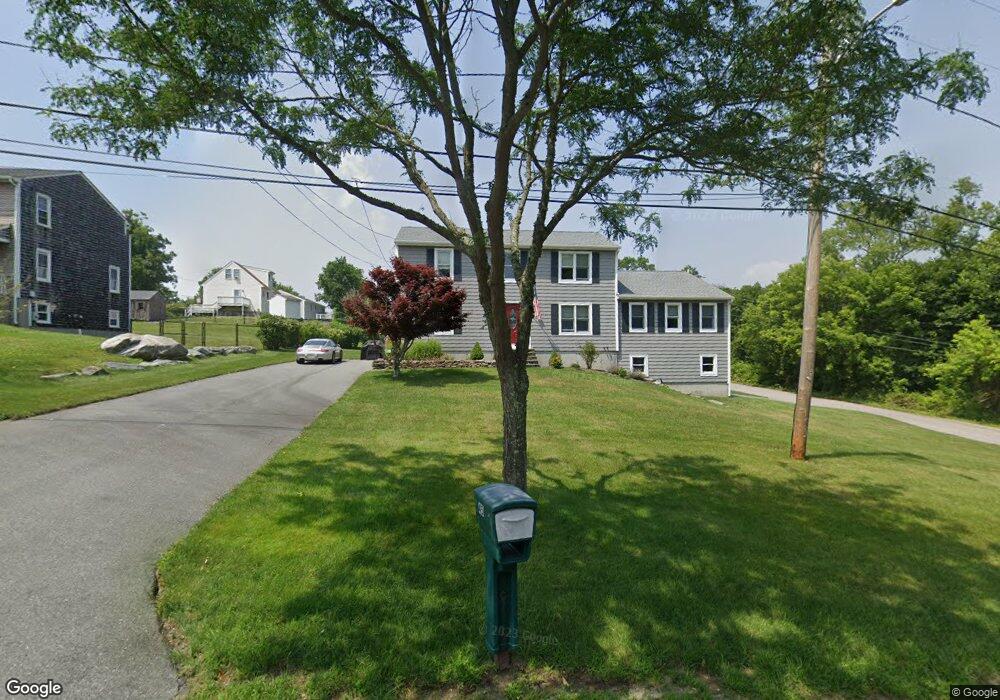
45 Tower St Bristol, RI 02809
Mount Hope NeighborhoodEstimated Value: $618,000 - $1,243,000
4
Beds
3
Baths
3,768
Sq Ft
$235/Sq Ft
Est. Value
About This Home
This home is located at 45 Tower St, Bristol, RI 02809 and is currently estimated at $886,083, approximately $235 per square foot. 45 Tower St is a home located in Bristol County with nearby schools including Mt. Hope High School and Our Lady of Mt. Carmel School.
Ownership History
Date
Name
Owned For
Owner Type
Purchase Details
Closed on
Feb 24, 2017
Sold by
Mcfarland David C
Bought by
D C Mcfarland Ret 2017
Current Estimated Value
Purchase Details
Closed on
Nov 4, 1996
Sold by
Lannan Julie M
Bought by
Mcfarland David C
Create a Home Valuation Report for This Property
The Home Valuation Report is an in-depth analysis detailing your home's value as well as a comparison with similar homes in the area
Home Values in the Area
Average Home Value in this Area
Purchase History
| Date | Buyer | Sale Price | Title Company |
|---|---|---|---|
| D C Mcfarland Ret 2017 | -- | -- | |
| Mcfarland David C | $140,000 | -- |
Source: Public Records
Mortgage History
| Date | Status | Borrower | Loan Amount |
|---|---|---|---|
| Previous Owner | Mcfarland David C | $231,500 | |
| Previous Owner | Mcfarland David C | $263,500 | |
| Previous Owner | Mcfarland David C | $167,500 | |
| Previous Owner | Mcfarland David C | $173,000 |
Source: Public Records
Tax History
| Year | Tax Paid | Tax Assessment Tax Assessment Total Assessment is a certain percentage of the fair market value that is determined by local assessors to be the total taxable value of land and additions on the property. | Land | Improvement |
|---|---|---|---|---|
| 2025 | $7,384 | $534,300 | $162,900 | $371,400 |
| 2024 | $7,384 | $534,300 | $162,900 | $371,400 |
| 2023 | $7,138 | $534,300 | $162,900 | $371,400 |
| 2022 | $6,946 | $534,300 | $162,900 | $371,400 |
| 2021 | $6,550 | $455,500 | $150,000 | $305,500 |
| 2020 | $6,409 | $455,500 | $150,000 | $305,500 |
| 2019 | $6,249 | $455,500 | $150,000 | $305,500 |
| 2018 | $6,949 | $451,800 | $143,200 | $308,600 |
| 2017 | $5,911 | $396,200 | $124,000 | $272,200 |
| 2016 | $5,852 | $396,200 | $124,000 | $272,200 |
| 2015 | $5,559 | $396,200 | $124,000 | $272,200 |
| 2014 | $5,816 | $445,350 | $147,000 | $298,350 |
Source: Public Records
Map
Nearby Homes
- 32 Massasoit Ave
- 30 Massasoit Ave
- 25 Massasoit Ave
- 27 Massasoit Ave
- 293 State St
- 11 Gladding St
- 79 Hopeworth Ave
- 236 State St
- 53 Catherine St
- 2 Chilton St
- 2 Wilson St
- 85 Bay View Ave Unit 2
- 88 Burton St
- 413 High St
- 78 State St
- 423 Hope St Unit 1A
- 44 Bradford St Unit 49
- 18 State St Unit 5 (3rd Floor East)
- 9 Hope St
- 30 Sowams Dr
Your Personal Tour Guide
Ask me questions while you tour the home.