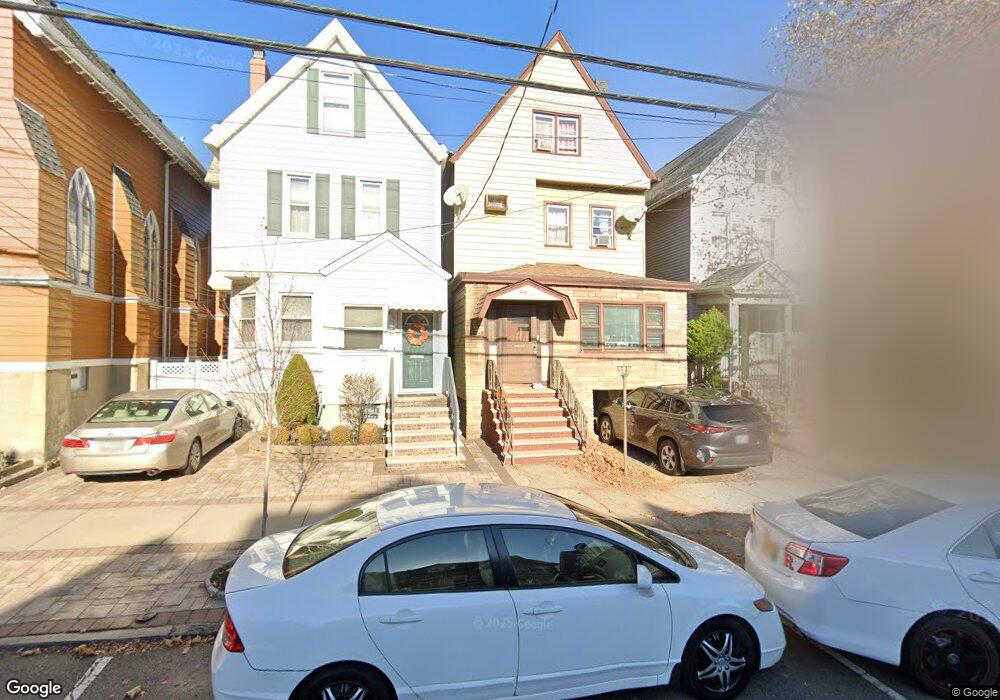
45 W 37th St Bayonne, NJ 07002
North Bayonne NeighborhoodEstimated Value: $686,696 - $792,000
1
Bed
1
Bath
1,980
Sq Ft
$369/Sq Ft
Est. Value
About This Home
This home is located at 45 W 37th St, Bayonne, NJ 07002 and is currently estimated at $730,924, approximately $369 per square foot. 45 W 37th St is a home located in Hudson County with nearby schools including Bayonne High School and Yeshiva Gedolah of Bayonne.
Ownership History
Date
Name
Owned For
Owner Type
Purchase Details
Closed on
May 31, 2016
Current Estimated Value
Home Financials for this Owner
Home Financials are based on the most recent Mortgage that was taken out on this home.
Original Mortgage
$60,000
Outstanding Balance
$47,862
Interest Rate
3.64%
Estimated Equity
$683,062
Purchase Details
Closed on
Dec 5, 2006
Sold by
Colon Israel A and Colon Evelyn
Purchase Details
Closed on
Jan 25, 2000
Sold by
Marek Veronica and Marek Stanley S
Bought by
Colon Israel A and Colon Evelyn
Home Financials for this Owner
Home Financials are based on the most recent Mortgage that was taken out on this home.
Original Mortgage
$161,400
Interest Rate
7.98%
Create a Home Valuation Report for This Property
The Home Valuation Report is an in-depth analysis detailing your home's value as well as a comparison with similar homes in the area
Home Values in the Area
Average Home Value in this Area
Purchase History
| Date | Buyer | Sale Price | Title Company |
|---|---|---|---|
| -- | -- | -- | |
| -- | $460,000 | County Title Agency Inc | |
| Colon Israel A | $169,900 | Commonwealth Land Title Ins |
Source: Public Records
Mortgage History
| Date | Status | Borrower | Loan Amount |
|---|---|---|---|
| Open | -- | $60,000 | |
| Closed | -- | -- | |
| Previous Owner | Colon Israel A | $161,400 |
Source: Public Records
Tax History Compared to Growth
Tax History
| Year | Tax Paid | Tax Assessment Tax Assessment Total Assessment is a certain percentage of the fair market value that is determined by local assessors to be the total taxable value of land and additions on the property. | Land | Improvement |
|---|---|---|---|---|
| 2025 | $11,153 | $398,900 | $180,000 | $218,900 |
| 2024 | $10,702 | $398,900 | $180,000 | $218,900 |
| 2023 | $10,702 | $398,900 | $180,000 | $218,900 |
| 2022 | $10,503 | $398,900 | $180,000 | $218,900 |
| 2021 | $10,419 | $398,900 | $180,000 | $218,900 |
| 2020 | $10,236 | $398,900 | $180,000 | $218,900 |
| 2019 | $11,944 | $138,400 | $62,500 | $75,900 |
| 2018 | $11,706 | $138,400 | $62,500 | $75,900 |
| 2017 | $11,403 | $138,400 | $62,500 | $75,900 |
| 2016 | $10,982 | $138,400 | $62,500 | $75,900 |
| 2015 | $10,621 | $138,400 | $62,500 | $75,900 |
| 2014 | $10,304 | $138,400 | $62,500 | $75,900 |
Source: Public Records
Map
Nearby Homes