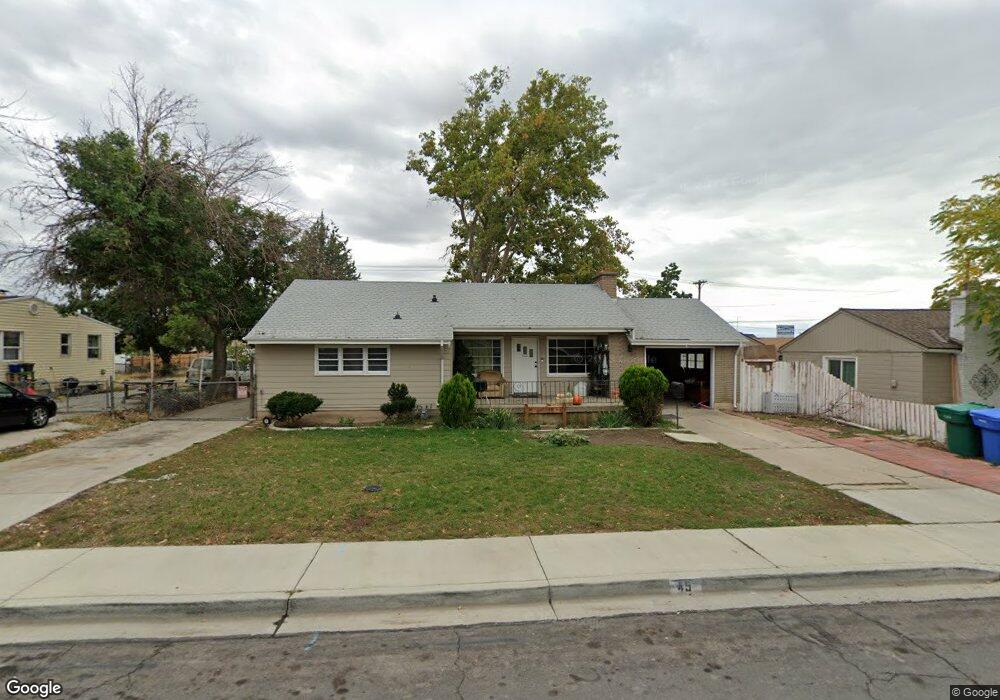
45 W 450 N Orem, UT 84057
Sharon NeighborhoodEstimated Value: $357,000 - $426,177
3
Beds
1
Bath
1,840
Sq Ft
$214/Sq Ft
Est. Value
About This Home
This home is located at 45 W 450 N, Orem, UT 84057 and is currently estimated at $393,726, approximately $213 per square foot. 45 W 450 N is a home located in Utah County with nearby schools including Cascade Elementary School, Canyon View Junior High School, and Orem High School.
Ownership History
Date
Name
Owned For
Owner Type
Purchase Details
Closed on
May 26, 2023
Sold by
Allred Tobiannys M
Bought by
Allred Tobiannys M and Cleve Sweet B
Current Estimated Value
Home Financials for this Owner
Home Financials are based on the most recent Mortgage that was taken out on this home.
Original Mortgage
$330,000
Outstanding Balance
$321,176
Interest Rate
6.39%
Mortgage Type
New Conventional
Estimated Equity
$72,550
Purchase Details
Closed on
Sep 10, 2021
Sold by
Allred Joshua J
Bought by
Allred Joshua J and Allred Tobiany
Purchase Details
Closed on
Jul 31, 2020
Sold by
Allred Joshua J and Allred Tobiany
Bought by
Allred Joshua J
Purchase Details
Closed on
Jun 13, 2014
Sold by
Darling Bryan
Bought by
Allred Joshua J
Purchase Details
Closed on
Nov 25, 2013
Sold by
Farrer Sara Ann
Bought by
Darling Bryan
Create a Home Valuation Report for This Property
The Home Valuation Report is an in-depth analysis detailing your home's value as well as a comparison with similar homes in the area
Home Values in the Area
Average Home Value in this Area
Purchase History
| Date | Buyer | Sale Price | Title Company |
|---|---|---|---|
| Allred Tobiannys M | -- | Sutherland Title | |
| Allred Tobiannys M | -- | Sutherland Title | |
| Allred Joshua J | -- | None Available | |
| Allred Joshua J | -- | Inwest Title Orem | |
| Allred Joshua J | -- | Pro Title And Escrow Inc | |
| Darling Bryan | -- | North American Title |
Source: Public Records
Mortgage History
| Date | Status | Borrower | Loan Amount |
|---|---|---|---|
| Open | Allred Tobiannys M | $330,000 |
Source: Public Records
Tax History
| Year | Tax Paid | Tax Assessment Tax Assessment Total Assessment is a certain percentage of the fair market value that is determined by local assessors to be the total taxable value of land and additions on the property. | Land | Improvement |
|---|---|---|---|---|
| 2025 | $1,612 | $208,945 | -- | -- |
| 2024 | $1,612 | $197,065 | $0 | $0 |
| 2023 | $1,475 | $193,875 | $0 | $0 |
| 2022 | $1,631 | $207,625 | $0 | $0 |
| 2021 | $1,392 | $268,500 | $134,900 | $133,600 |
| 2020 | $1,260 | $238,900 | $107,900 | $131,000 |
| 2019 | $1,159 | $228,500 | $97,500 | $131,000 |
| 2018 | $1,067 | $200,900 | $87,000 | $113,900 |
| 2017 | $978 | $98,670 | $0 | $0 |
| 2016 | $906 | $84,315 | $0 | $0 |
| 2015 | $951 | $83,655 | $0 | $0 |
| 2014 | $879 | $77,000 | $0 | $0 |
Source: Public Records
Map
Nearby Homes
Your Personal Tour Guide
Ask me questions while you tour the home.