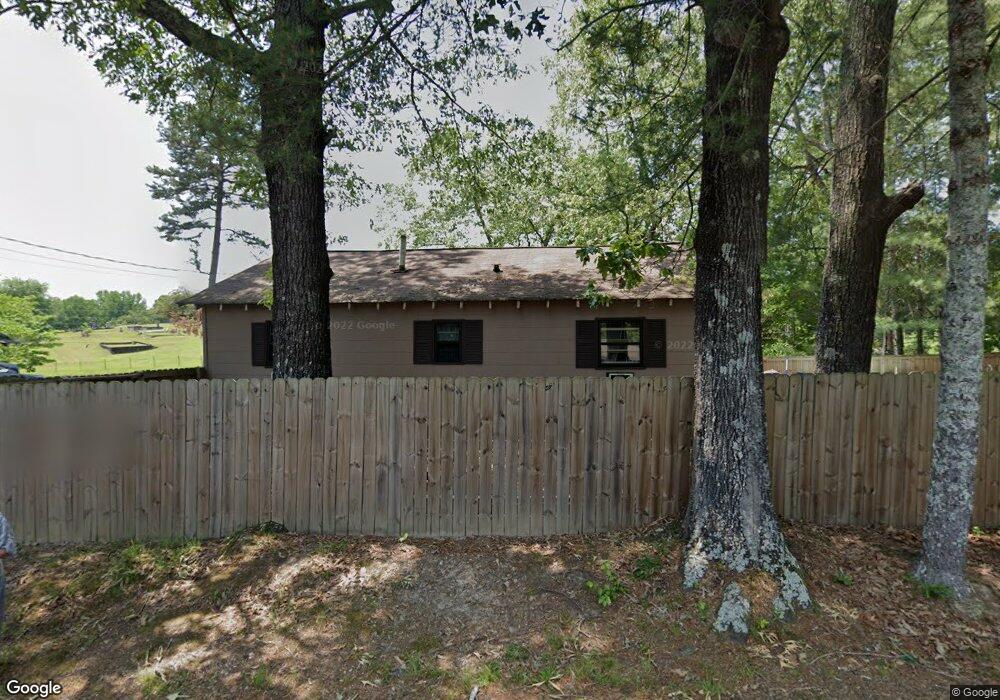
45 Watson Extension Toccoa, GA 30577
Estimated Value: $117,000 - $214,000
2
Beds
1
Bath
988
Sq Ft
$154/Sq Ft
Est. Value
About This Home
This home is located at 45 Watson Extension, Toccoa, GA 30577 and is currently estimated at $152,473, approximately $154 per square foot. 45 Watson Extension is a home located in Stephens County with nearby schools including Stephens County High School.
Ownership History
Date
Name
Owned For
Owner Type
Purchase Details
Closed on
Dec 28, 2015
Sold by
Sanders Realty Llp
Bought by
Kelley Michael
Current Estimated Value
Purchase Details
Closed on
Jan 29, 2003
Sold by
Stephens Curtis Lee
Bought by
Sanders Realty Llp
Purchase Details
Closed on
Dec 13, 2001
Sold by
Stephens Frances S
Bought by
Stephens Curtis Lee
Purchase Details
Closed on
Sep 27, 1977
Sold by
Stephens Curtis Lee
Bought by
Stephens Curtis Lee and Stephens Frances S
Purchase Details
Closed on
Feb 27, 1962
Sold by
Martin Lumber Company
Bought by
Norris Christine M and Norris Sanford W
Purchase Details
Closed on
Dec 2, 1961
Sold by
Corley Lenward
Bought by
Martin Lumber Company
Purchase Details
Closed on
Mar 14, 1955
Sold by
Beard John S
Bought by
Corley Lenward
Purchase Details
Closed on
Jan 1, 1952
Sold by
Ertzberger K L
Bought by
Beard John S
Purchase Details
Closed on
Mar 1, 1949
Sold by
Cleveland Percy
Bought by
Ertzberger K L
Create a Home Valuation Report for This Property
The Home Valuation Report is an in-depth analysis detailing your home's value as well as a comparison with similar homes in the area
Purchase History
| Date | Buyer | Sale Price | Title Company |
|---|---|---|---|
| Kelley Michael | $35,000 | -- | |
| Sanders Realty Llp | $49,500 | -- | |
| Stephens Curtis Lee | -- | -- | |
| Stephens Curtis Lee | -- | -- | |
| Norris Christine M | -- | -- | |
| Martin Lumber Company | -- | -- | |
| Corley Lenward | -- | -- | |
| Beard John S | -- | -- | |
| Ertzberger K L | -- | -- |
Source: Public Records
Tax History
| Year | Tax Paid | Tax Assessment Tax Assessment Total Assessment is a certain percentage of the fair market value that is determined by local assessors to be the total taxable value of land and additions on the property. | Land | Improvement |
|---|---|---|---|---|
| 2025 | $837 | $28,192 | $3,662 | $24,530 |
| 2024 | $702 | $19,700 | $3,662 | $16,038 |
| 2023 | $563 | $18,506 | $3,662 | $14,844 |
| 2022 | $510 | $17,144 | $3,662 | $13,482 |
| 2021 | $474 | $15,153 | $3,662 | $11,491 |
| 2020 | $497 | $15,752 | $3,662 | $12,090 |
| 2019 | $499 | $15,752 | $3,662 | $12,090 |
| 2018 | $499 | $15,752 | $3,662 | $12,090 |
| 2017 | $507 | $15,752 | $3,662 | $12,090 |
| 2016 | $444 | $15,751 | $3,661 | $12,090 |
| 2015 | $536 | $16,143 | $3,661 | $12,482 |
| 2014 | $585 | $17,342 | $3,662 | $13,680 |
| 2013 | -- | $17,341 | $3,661 | $13,680 |
Source: Public Records
Map
Nearby Homes
- 326 Remsdale Rd
- 596 Watson St
- 481 W Currahee St
- 18 W Currahee St
- 10 Busha St
- 259 E Currahee St
- 120 S Pine St
- 51 Busha St
- 27 Rock Quarry Rd
- 198 S Broad St
- 239 E Doyle St
- 109 Schaefer Ct
- 31 Craig St
- 345 Prather Bridge Rd
- 288 S Broad St
- 35 Green Hill Place
- 50 Green Hill Place
- 84 Oak Creek Cir
- 53 Cole Manor Dr
- 84 Park St
- 52 Watson St
- 470 Falls Rd
- 70 Watson St
- 61 Henderson Falls Rd
- 63 Henderson Falls Rd
- 639 Falls Rd
- 35 Jewell St
- 531 Falls Rd
- 70 Watson Extension
- 580 Falls Rd
- 40 Watson St
- 19 Cooper St
- 14 Henderson Falls Rd
- 585 Falls Rd
- 141 Henderson Falls Rd
- 194 Remsdale St Unit A
- 0 Watson St Unit 8425367
- 0 Watson St Unit Lot 4 8988044
- 0 Watson St Unit 6595444
- 0 Watson St Unit 8632921