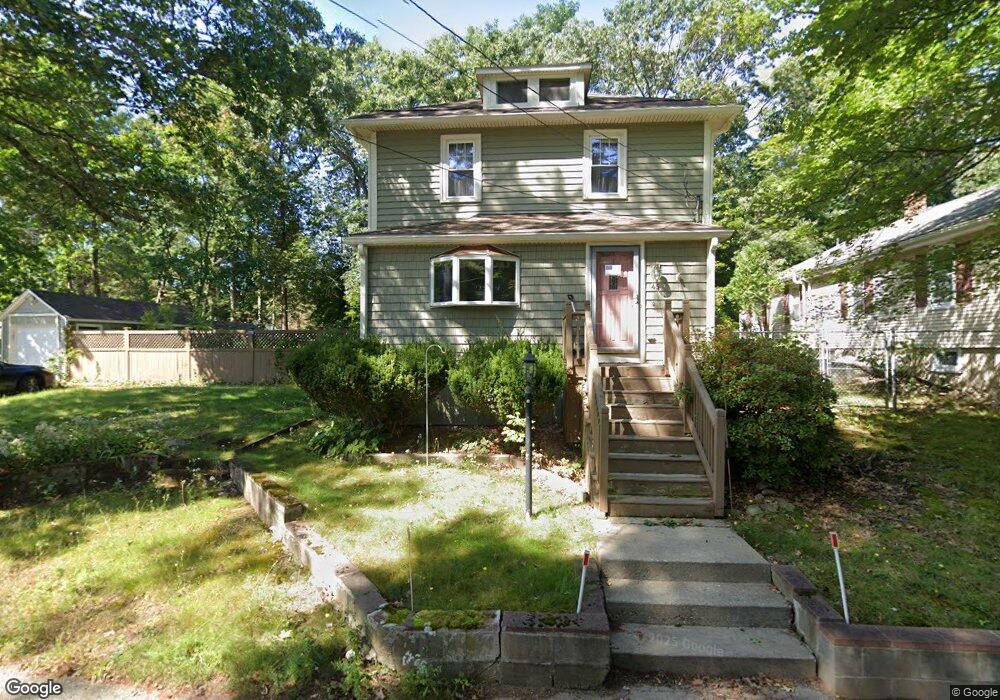
45 Wilmarth Rd Randolph, MA 02368
Downtown Randolph NeighborhoodEstimated Value: $606,618 - $664,000
3
Beds
2
Baths
1,750
Sq Ft
$356/Sq Ft
Est. Value
About This Home
This home is located at 45 Wilmarth Rd, Randolph, MA 02368 and is currently estimated at $623,655, approximately $356 per square foot. 45 Wilmarth Rd is a home located in Norfolk County with nearby schools including Randolph High School, Boston Higashi School, and Lighthouse Baptist Christian Academy.
Ownership History
Date
Name
Owned For
Owner Type
Purchase Details
Closed on
Feb 29, 2016
Sold by
Sullivan Alfred J
Bought by
Sullivan Alfred J and Sullivan Zakia
Current Estimated Value
Create a Home Valuation Report for This Property
The Home Valuation Report is an in-depth analysis detailing your home's value as well as a comparison with similar homes in the area
Home Values in the Area
Average Home Value in this Area
Purchase History
| Date | Buyer | Sale Price | Title Company |
|---|---|---|---|
| Sullivan Alfred J | -- | -- |
Source: Public Records
Tax History Compared to Growth
Tax History
| Year | Tax Paid | Tax Assessment Tax Assessment Total Assessment is a certain percentage of the fair market value that is determined by local assessors to be the total taxable value of land and additions on the property. | Land | Improvement |
|---|---|---|---|---|
| 2025 | $6,382 | $549,700 | $240,300 | $309,400 |
| 2024 | $6,271 | $547,700 | $235,600 | $312,100 |
| 2023 | $5,825 | $482,200 | $214,100 | $268,100 |
| 2022 | $5,503 | $404,600 | $178,400 | $226,200 |
| 2021 | $5,238 | $354,400 | $148,700 | $205,700 |
| 2020 | $5,295 | $355,100 | $148,700 | $206,400 |
| 2019 | $5,071 | $338,500 | $141,600 | $196,900 |
| 2018 | $4,885 | $307,600 | $131,200 | $176,400 |
| 2017 | $4,875 | $301,300 | $124,900 | $176,400 |
| 2016 | $4,707 | $270,700 | $113,600 | $157,100 |
| 2015 | $4,503 | $248,800 | $108,200 | $140,600 |
Source: Public Records
Map
Nearby Homes
- 46 Wilmarth Rd
- 7 Morton Rd
- 229 Mill St
- 217 Mill St
- 89 Fernandez Cir
- 327 Union St
- 10 Alfred Terrace
- 96 Roberts Ave
- 314 South St
- 346 South St
- 46 Union Square Unit 46
- 5 Patterson Ave E
- 17 Mill St
- 63 Cedarhill Rd
- 5 Clarendon Cir Unit Lot 4
- 4 Lori Ln
- 12 Cottage St
- 15 Barbara Rd
- 9 Madison Ave
- 27 Winter St