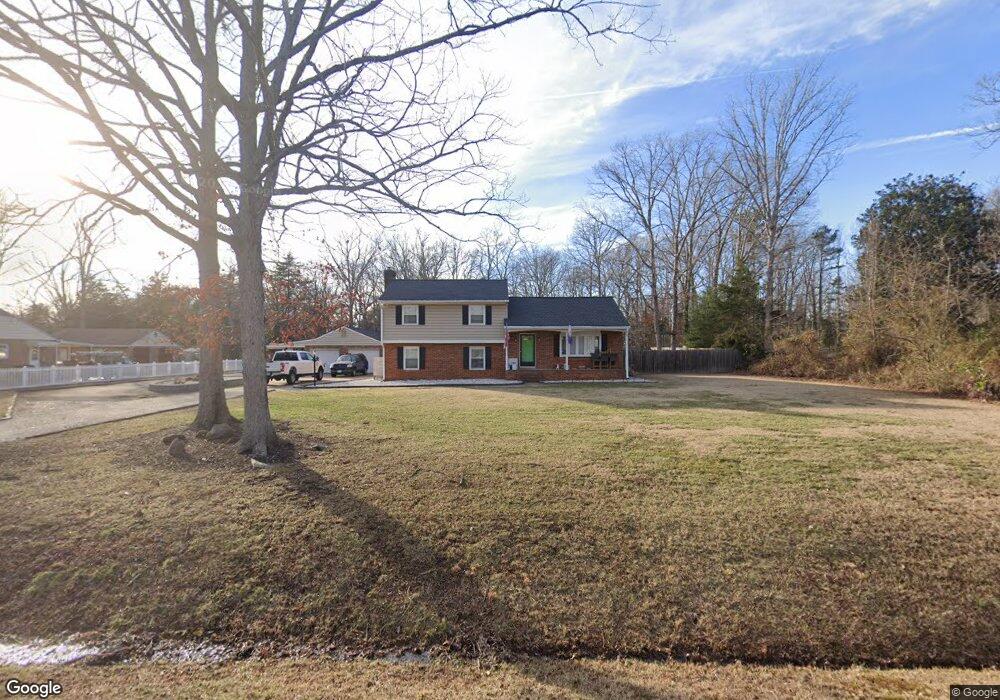
450 Charlemagne Rd Midlothian, VA 23114
Estimated Value: $428,000 - $472,045
4
Beds
3
Baths
1,926
Sq Ft
$232/Sq Ft
Est. Value
About This Home
This home is located at 450 Charlemagne Rd, Midlothian, VA 23114 and is currently estimated at $446,011, approximately $231 per square foot. 450 Charlemagne Rd is a home located in Chesterfield County with nearby schools including J B Watkins Elementary School, Midlothian Middle School, and Midlothian High School.
Ownership History
Date
Name
Owned For
Owner Type
Purchase Details
Closed on
Apr 22, 2021
Sold by
Adams Andrew C and Aadms Stephanie
Bought by
Savchenko Daria and Dudding Jeffrey
Current Estimated Value
Home Financials for this Owner
Home Financials are based on the most recent Mortgage that was taken out on this home.
Original Mortgage
$280,000
Outstanding Balance
$253,210
Interest Rate
3.1%
Mortgage Type
New Conventional
Estimated Equity
$192,801
Purchase Details
Closed on
May 7, 2010
Sold by
Dykes Robert M and Deverry Yvonne A
Bought by
Adams Andrew C
Home Financials for this Owner
Home Financials are based on the most recent Mortgage that was taken out on this home.
Original Mortgage
$249,287
Interest Rate
5.13%
Mortgage Type
FHA
Purchase Details
Closed on
Mar 26, 2002
Bought by
Deverry Yvonne A
Home Financials for this Owner
Home Financials are based on the most recent Mortgage that was taken out on this home.
Original Mortgage
$149,200
Interest Rate
6.91%
Mortgage Type
New Conventional
Create a Home Valuation Report for This Property
The Home Valuation Report is an in-depth analysis detailing your home's value as well as a comparison with similar homes in the area
Home Values in the Area
Average Home Value in this Area
Purchase History
| Date | Buyer | Sale Price | Title Company |
|---|---|---|---|
| Savchenko Daria | $350,000 | Attorney | |
| Adams Andrew C | $265,000 | -- | |
| Deverry Yvonne A | -- | -- | |
| Deverry Yvonne A | -- | -- | |
| Dykes Robert M | $186,500 | -- |
Source: Public Records
Mortgage History
| Date | Status | Borrower | Loan Amount |
|---|---|---|---|
| Open | Savchenko Daria | $280,000 | |
| Previous Owner | Adams Andrew C | $249,287 | |
| Previous Owner | Dykes Robert M | $149,200 | |
| Previous Owner | Dykes Robert M | $18,650 |
Source: Public Records
Tax History Compared to Growth
Tax History
| Year | Tax Paid | Tax Assessment Tax Assessment Total Assessment is a certain percentage of the fair market value that is determined by local assessors to be the total taxable value of land and additions on the property. | Land | Improvement |
|---|---|---|---|---|
| 2025 | $3,401 | $379,300 | $70,000 | $309,300 |
| 2024 | $3,401 | $373,300 | $70,000 | $303,300 |
| 2023 | $3,160 | $347,200 | $65,000 | $282,200 |
| 2022 | $3,023 | $328,600 | $61,000 | $267,600 |
| 2021 | $2,869 | $297,200 | $59,000 | $238,200 |
| 2020 | $2,729 | $287,300 | $58,000 | $229,300 |
| 2019 | $2,565 | $270,000 | $58,000 | $212,000 |
| 2018 | $2,502 | $265,500 | $58,000 | $207,500 |
| 2017 | $2,433 | $248,200 | $58,000 | $190,200 |
| 2016 | $2,330 | $242,700 | $58,000 | $184,700 |
| 2015 | $2,234 | $230,100 | $58,000 | $172,100 |
| 2014 | $2,224 | $229,100 | $57,000 | $172,100 |
Source: Public Records
Map
Nearby Homes
- 14424 Aldengate Rd
- 207 Wallingham Dr
- 906 Landon Laurel Ln
- 918 Landon Laurel Ln
- 924 Landon Laurel Ln
- 937 Charlemagne Rd
- 943 Charlemagne Rd
- 937 Landon Laurel Ln
- 949 Charlemagne Rd
- 942 Landon Laurel Ln
- 943 Landon Laurel Ln
- 955 Charlemagne Rd
- 961 Charlemagne Rd
- 949 Landon Laurel Ln
- 967 Charlemagne Rd
- 955 Landon Laurel Ln
- 961 Landon Laurel Ln
- Oasis Plan at Landon Village - Clarity Collection
- Haven Plan at Landon Village - Clarity Collection
- Refuge Plan at Landon Village - Clarity Collection
- 500 Charlemagne Rd
- 440 Charlemagne Rd
- 501 Charlemagne Rd
- 441 Charlemagne Rd
- 501 Paddington Dr
- 430 Charlemagne Rd
- 421 Paddington Dr
- 14511 Charlemagne Ct
- 14510 Charlemagne Ct
- 431 Charlemagne Rd
- 411 Paddington Dr
- 420 Charlemagne Rd
- 520 Charlemagne Rd
- 421 Charlemagne Rd
- 331 Old Otterdale Rd
- 14503 Charlemagne Ct
- 14501 Charlemagne Ct
- 420 Paddington Dr
- 500 Paddington Dr
- 410 Charlemagne Rd