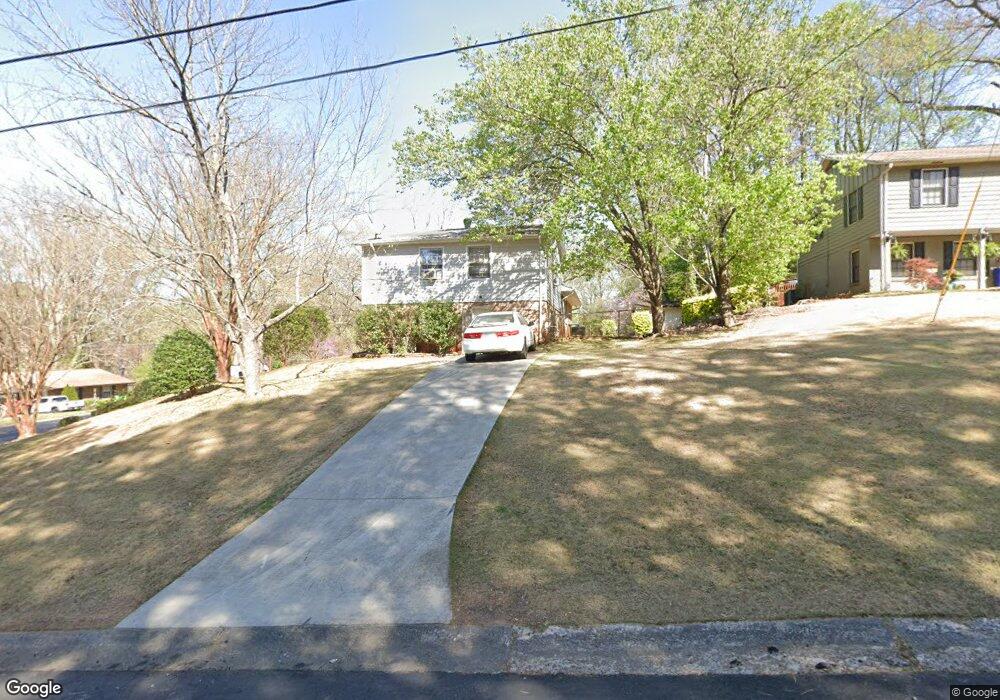
450 Dan Place SE Unit 6 Smyrna, GA 30082
Estimated Value: $270,000 - $358,000
3
Beds
2
Baths
1,785
Sq Ft
$181/Sq Ft
Est. Value
About This Home
This home is located at 450 Dan Place SE Unit 6, Smyrna, GA 30082 and is currently estimated at $322,387, approximately $180 per square foot. 450 Dan Place SE Unit 6 is a home located in Cobb County with nearby schools including Norton Park Elementary School, Griffin Middle School, and Campbell High School.
Ownership History
Date
Name
Owned For
Owner Type
Purchase Details
Closed on
Dec 6, 2021
Sold by
Ti4 Llc
Bought by
Ti Duplexes Llc
Current Estimated Value
Purchase Details
Closed on
Mar 23, 2017
Sold by
Robinson Monica
Bought by
T14 Llc
Purchase Details
Closed on
Sep 12, 2002
Sold by
Shepherd Troy F and Shepherd Tricia D
Bought by
Robinson Monica
Home Financials for this Owner
Home Financials are based on the most recent Mortgage that was taken out on this home.
Original Mortgage
$136,230
Interest Rate
6.3%
Mortgage Type
New Conventional
Purchase Details
Closed on
Jul 28, 1997
Sold by
Durbin Donald L and Durbin Shirley
Bought by
Shepherd Troy F and Shepherd Tricia D
Home Financials for this Owner
Home Financials are based on the most recent Mortgage that was taken out on this home.
Original Mortgage
$93,950
Interest Rate
7.25%
Mortgage Type
New Conventional
Create a Home Valuation Report for This Property
The Home Valuation Report is an in-depth analysis detailing your home's value as well as a comparison with similar homes in the area
Home Values in the Area
Average Home Value in this Area
Purchase History
| Date | Buyer | Sale Price | Title Company |
|---|---|---|---|
| Ti Duplexes Llc | -- | None Listed On Document | |
| T14 Llc | $120,000 | -- | |
| Robinson Monica | $143,400 | -- | |
| Shepherd Troy F | $98,900 | -- |
Source: Public Records
Mortgage History
| Date | Status | Borrower | Loan Amount |
|---|---|---|---|
| Previous Owner | Robinson Monica | $136,230 | |
| Previous Owner | Shepherd Troy F | $93,950 |
Source: Public Records
Tax History Compared to Growth
Tax History
| Year | Tax Paid | Tax Assessment Tax Assessment Total Assessment is a certain percentage of the fair market value that is determined by local assessors to be the total taxable value of land and additions on the property. | Land | Improvement |
|---|---|---|---|---|
| 2025 | $3,391 | $112,551 | $32,000 | $80,551 |
| 2024 | $3,463 | $114,848 | $32,000 | $82,848 |
| 2023 | $3,207 | $106,352 | $30,000 | $76,352 |
| 2022 | $3,228 | $106,352 | $30,000 | $76,352 |
| 2021 | $2,391 | $78,784 | $30,000 | $48,784 |
| 2020 | $2,391 | $78,784 | $30,000 | $48,784 |
| 2019 | $2,051 | $67,588 | $18,000 | $49,588 |
| 2018 | $1,457 | $48,000 | $15,800 | $32,200 |
| 2017 | $1,570 | $54,620 | $18,000 | $36,620 |
| 2016 | $1,315 | $45,724 | $18,000 | $27,724 |
| 2015 | $1,142 | $38,772 | $18,000 | $20,772 |
| 2014 | $346 | $38,772 | $0 | $0 |
Source: Public Records
Map
Nearby Homes
- 3313 Hidden Trail Rd SE
- 3288 Old Concord Rd SE Unit 1
- 3390 Kenland Rd SE
- 3375 Emerson St SE
- 358 Nature Brook Walk SE
- 3158 Autumn Brook Trail SE
- 576 Cresentry Brook
- 1084 Huntington Trace SE
- 1104 Huntington Trace SE
- 629 Dunton Cir SE
- 3235 Woodview Dr SE
- 1028 Huntington Trace SE
- 273 Aventine Ln
- 3462 S Sherwood Rd SE
- 3216 Woodview Dr SE
- 3244 Hampton Ct SE
- 2964 Nursery Rd SE
- 552 Micayne Cir SE Unit 1
- 450 Dan Place SE Unit 450
- 450 Dan Place SE
- 450 Dan Place SE Unit 2
- 3341 Griffin Terrace SE
- 462 Dan Place SE
- 445 Dan Place SE
- 455 Dan Place SE Unit 6
- 430 Dan Place SE
- 3351 Griffin Terrace SE
- 435 Dan Place SE
- 463 Dan Place SE
- 3344 Griffin Terrace SE
- 472 Dan Place SE
- 0 Griffin Terrace Unit 7255587
- 0 Griffin Terrace Unit 3246711
- 0 Griffin Terrace Unit 3164434
- 0 Griffin Terrace Unit 8826413
- 0 Griffin Terrace Unit 8407387
- 0 Griffin Terrace Unit 8202937
- 0 Griffin Terrace