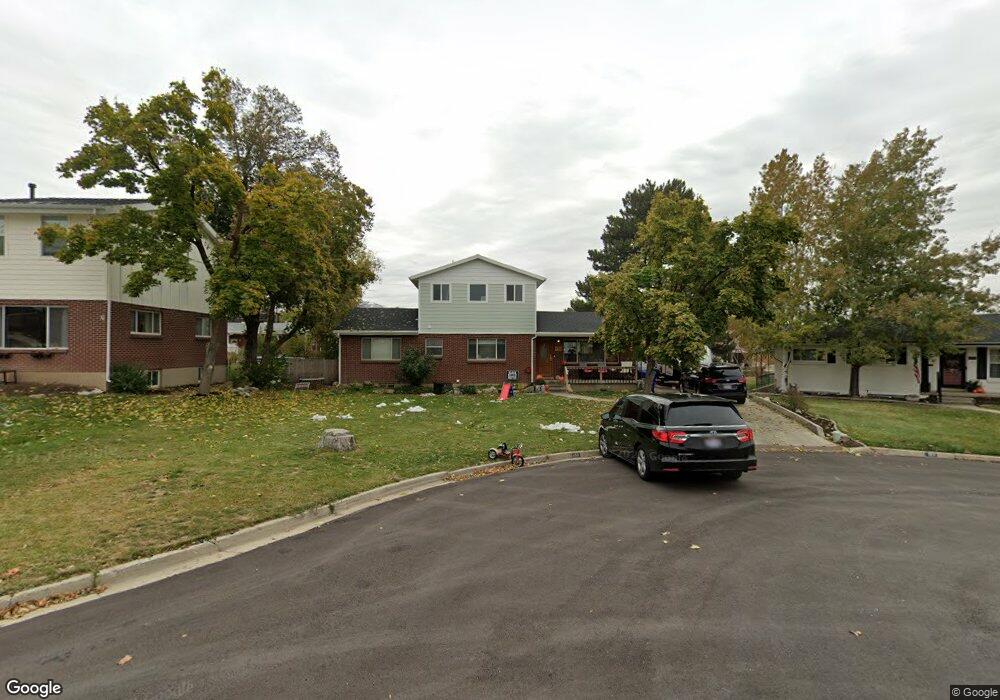
450 E 350 N Bountiful, UT 84010
Estimated Value: $581,000 - $603,000
3
Beds
2
Baths
2,574
Sq Ft
$230/Sq Ft
Est. Value
About This Home
This home is located at 450 E 350 N, Bountiful, UT 84010 and is currently estimated at $592,750, approximately $230 per square foot. 450 E 350 N is a home located in Davis County with nearby schools including Holbrook Elementary School, Bountiful Junior High School, and Bountiful High School.
Ownership History
Date
Name
Owned For
Owner Type
Purchase Details
Closed on
May 24, 2018
Sold by
Davis Nicholas L and Davis Tabitha L
Bought by
Davis Nicholas John and Davis Tabitha
Current Estimated Value
Home Financials for this Owner
Home Financials are based on the most recent Mortgage that was taken out on this home.
Original Mortgage
$253,600
Outstanding Balance
$218,358
Interest Rate
4.4%
Mortgage Type
New Conventional
Estimated Equity
$374,392
Purchase Details
Closed on
Jan 10, 2013
Sold by
Allred Geri Lynne
Bought by
Davis Nicholas J and Davis Tabitha L
Home Financials for this Owner
Home Financials are based on the most recent Mortgage that was taken out on this home.
Original Mortgage
$11,800
Interest Rate
3.27%
Mortgage Type
Unknown
Purchase Details
Closed on
Oct 11, 2008
Sold by
Allred Scott T and Allred Geri L
Bought by
Allred Geri Lynne
Create a Home Valuation Report for This Property
The Home Valuation Report is an in-depth analysis detailing your home's value as well as a comparison with similar homes in the area
Purchase History
| Date | Buyer | Sale Price | Title Company |
|---|---|---|---|
| Davis Nicholas John | -- | Cottonwood Title | |
| Davis Nicholas J | -- | North American Title | |
| Allred Geri Lynne | -- | None Available |
Source: Public Records
Mortgage History
| Date | Status | Borrower | Loan Amount |
|---|---|---|---|
| Open | Davis Nicholas John | $253,600 | |
| Closed | Davis Nicholas J | $11,800 | |
| Closed | Davis Nicholas J | $230,644 |
Source: Public Records
Tax History
| Year | Tax Paid | Tax Assessment Tax Assessment Total Assessment is a certain percentage of the fair market value that is determined by local assessors to be the total taxable value of land and additions on the property. | Land | Improvement |
|---|---|---|---|---|
| 2025 | $3,580 | $325,600 | $149,756 | $175,844 |
| 2024 | $3,383 | $318,450 | $137,928 | $180,522 |
| 2023 | $3,365 | $576,000 | $252,007 | $323,993 |
| 2022 | $2,914 | $270,600 | $134,460 | $136,140 |
| 2021 | $2,441 | $345,000 | $200,010 | $144,990 |
| 2020 | $2,151 | $304,000 | $182,077 | $121,923 |
| 2019 | $2,152 | $297,000 | $175,115 | $121,885 |
| 2018 | $2,027 | $275,000 | $163,242 | $111,758 |
| 2016 | $1,810 | $133,320 | $53,854 | $79,466 |
| 2015 | $1,813 | $126,335 | $53,854 | $72,481 |
| 2014 | $1,800 | $129,264 | $53,854 | $75,410 |
| 2013 | -- | $120,161 | $57,309 | $62,852 |
Source: Public Records
Map
Nearby Homes
- 513 N 400 E Unit 14B
- 453 N 400 E Unit 7-D
- 683 E 100 N
- 129 N 800 E
- 49 E 200 N Unit 4
- 41 E 200 N Unit 6
- 17 E 400 N Unit 19B
- 6 N 800 E
- 55 E 200 N Unit 2
- 51 E 200 N Unit 3
- 256 N Main St
- 254 N Main St
- 252 N Main St
- 978 N 170 E
- 255 E 400 S
- 357 S 100 E
- 214 E 1250 N
- 456 E 500 S
- 520 S Orchard Dr Unit 17
- 106 W 700 N
Your Personal Tour Guide
Ask me questions while you tour the home.