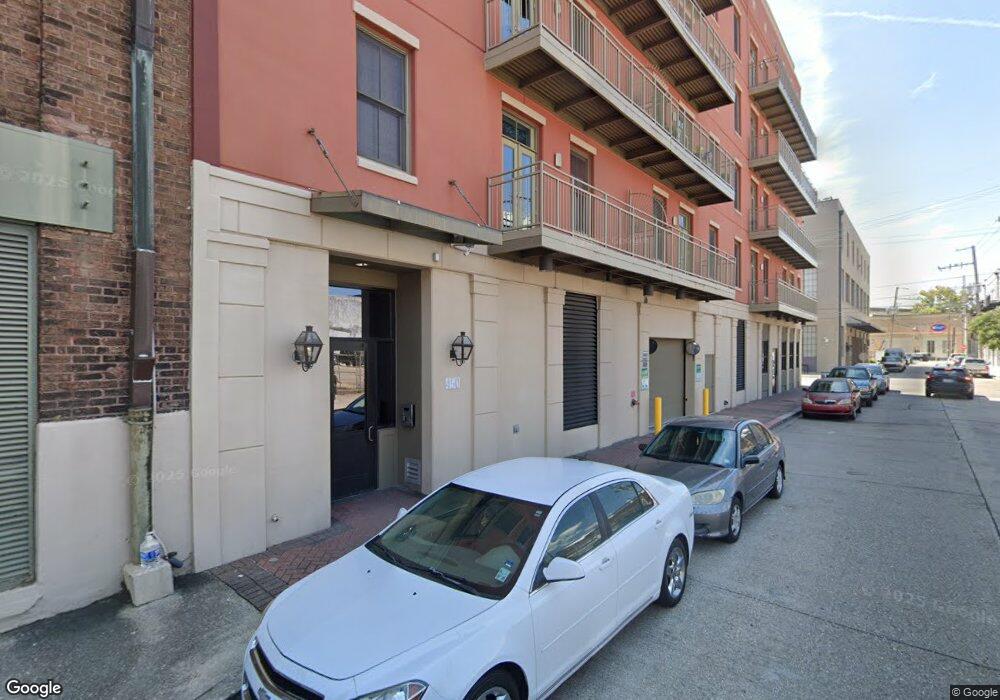
450 John Churchill Chase St Unit 406 New Orleans, LA 70130
Lower Garden District NeighborhoodEstimated Value: $438,000 - $456,000
2
Beds
2
Baths
1,221
Sq Ft
$365/Sq Ft
Est. Value
About This Home
This home is located at 450 John Churchill Chase St Unit 406, New Orleans, LA 70130 and is currently estimated at $445,345, approximately $364 per square foot. 450 John Churchill Chase St Unit 406 is a home located in Orleans Parish with nearby schools including International School of Louisiana - Uptown Campus, The NET Charter High School, and Warren Easton Senior High School.
Ownership History
Date
Name
Owned For
Owner Type
Purchase Details
Closed on
Nov 8, 2013
Sold by
Johnson Lisa J
Bought by
Pierce Linda D
Current Estimated Value
Home Financials for this Owner
Home Financials are based on the most recent Mortgage that was taken out on this home.
Original Mortgage
$304,000
Outstanding Balance
$227,157
Interest Rate
4.28%
Mortgage Type
New Conventional
Estimated Equity
$218,188
Purchase Details
Closed on
Mar 30, 2007
Sold by
Mills Row Llc
Bought by
Bristo William L
Home Financials for this Owner
Home Financials are based on the most recent Mortgage that was taken out on this home.
Original Mortgage
$292,000
Interest Rate
6.3%
Create a Home Valuation Report for This Property
The Home Valuation Report is an in-depth analysis detailing your home's value as well as a comparison with similar homes in the area
Home Values in the Area
Average Home Value in this Area
Purchase History
| Date | Buyer | Sale Price | Title Company |
|---|---|---|---|
| Pierce Linda D | -- | -- | |
| Johnson Lisa J | $380,000 | -- | |
| Bristo William L | $365,000 | -- |
Source: Public Records
Mortgage History
| Date | Status | Borrower | Loan Amount |
|---|---|---|---|
| Open | Johnson Lisa J | $304,000 | |
| Previous Owner | Bristo William L | $292,000 |
Source: Public Records
Tax History Compared to Growth
Tax History
| Year | Tax Paid | Tax Assessment Tax Assessment Total Assessment is a certain percentage of the fair market value that is determined by local assessors to be the total taxable value of land and additions on the property. | Land | Improvement |
|---|---|---|---|---|
| 2025 | $5,163 | $42,340 | $7,690 | $34,650 |
| 2024 | $5,233 | $42,340 | $7,690 | $34,650 |
| 2023 | $4,775 | $38,710 | $7,330 | $31,380 |
| 2022 | $4,775 | $37,140 | $7,330 | $29,810 |
| 2021 | $5,124 | $38,710 | $7,330 | $31,380 |
| 2020 | $5,095 | $38,710 | $7,330 | $31,380 |
| 2019 | $3,966 | $30,830 | $7,330 | $23,500 |
| 2018 | $4,036 | $30,830 | $7,330 | $23,500 |
| 2017 | $3,855 | $30,830 | $7,330 | $23,500 |
| 2016 | $3,964 | $30,830 | $7,330 | $23,500 |
| 2015 | $6,210 | $38,000 | $1,670 | $36,330 |
| 2014 | -- | $32,810 | $1,670 | $31,140 |
| 2013 | -- | $32,810 | $1,670 | $31,140 |
Source: Public Records
Map
Nearby Homes
- 1103 Tchoupitoulas St Unit 102
- 450 John Churchill Chase St Unit 205
- 1131 Tchoupitoulas St
- 920 Poeyfarre St Unit 203
- 920 Poeyfarre St Unit 308
- 920 Poeyfarre St Unit 303
- 920 Poeyfarre St Unit 322
- 920 Poeyfarre St Unit 355
- 920 Poeyfarre St Unit 326
- 920 Poeyfarre St Unit 161
- 920 Poeyfarre St Unit PH18
- 920 Poeyfarre St Unit 373
- 920 Poeyfarre St Unit 109
- 920 Poeyfarre St Unit 114
- 920 Poeyfarre St Unit 132
- 920 Poeyfarre St Unit 170
- 920 Poeyfarre St Unit 102
- 450 John Churchill Chase St Unit 504
- 450 John Churchill Chase St Unit 503
- 450 John Churchill Chase St Unit 502
- 450 John Churchill Chase St Unit 408
- 450 John Churchill Chase St Unit 307
- 450 John Churchill Chase St Unit 506
- 450 John Churchill Chase St Unit 304
- 450 John Churchill Chase St Unit 204
- 450 John Churchill Chase St Unit 201
- 450 John Churchill Chase St Unit 505
- 450 John Churchill Chase St Unit 403
- 450 John Churchill Chase St Unit 401
- 450 John Churchill Chase St Unit 405
- 450 John Churchill Chase St Unit 301
- 450 John Churchill Chase St Unit 302
- 450 John Churchill Chase St Unit 305
- 450 John Churchill Chase St Unit 202
- 450 John Churchill Chase St Unit 306
- 450 John Churchill Chase St Unit 203
- 450 John Churchill Chase St Unit 308