Estimated Value: $579,039
--
Bed
--
Bath
1,236
Sq Ft
$468/Sq Ft
Est. Value
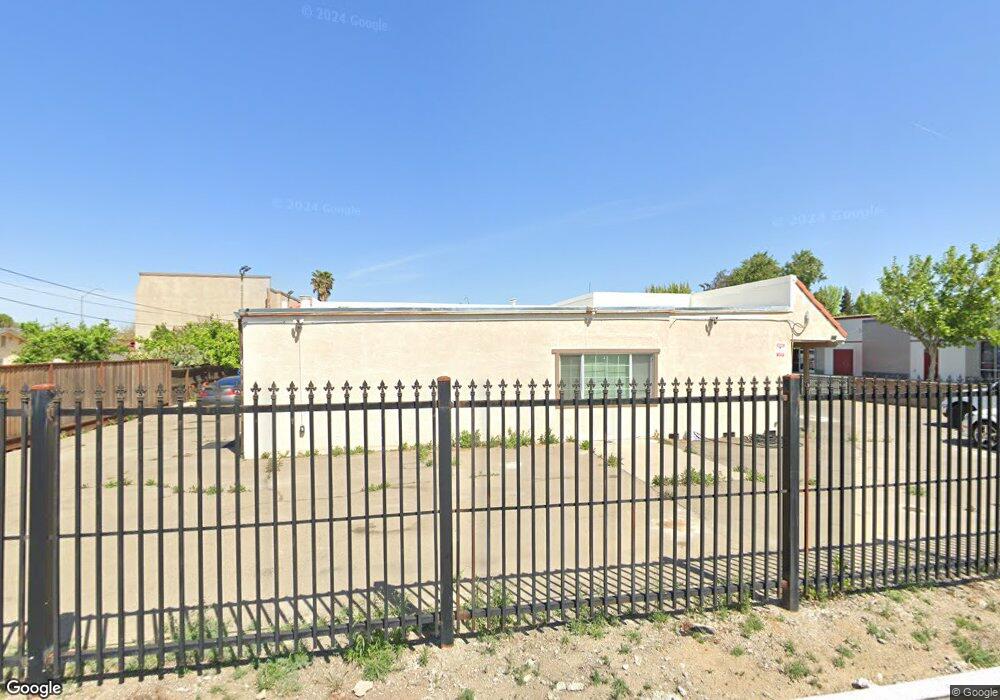
About This Home
This home is located at 450 W Grant Line Rd, Tracy, CA 95376 and is currently estimated at $579,039, approximately $468 per square foot. 450 W Grant Line Rd is a home located in San Joaquin County with nearby schools including Central Elementary School, Merrill F. West High School, and Bella Vista Christian Academy.
Ownership History
Date
Name
Owned For
Owner Type
Purchase Details
Closed on
Jun 15, 2022
Sold by
Kumar and Pinky
Bought by
Kumar Family Trust
Current Estimated Value
Purchase Details
Closed on
May 27, 2015
Sold by
Monetti David A and Monetti Margarete Ann
Bought by
Kumar Ajay and Kumari Pinki
Purchase Details
Closed on
Jan 1, 1999
Sold by
Richmond Robert L and Richmond B L
Bought by
Monetti David A and Monetti Margarete Ann
Home Financials for this Owner
Home Financials are based on the most recent Mortgage that was taken out on this home.
Original Mortgage
$172,500
Interest Rate
6.73%
Mortgage Type
Commercial
Purchase Details
Closed on
Jul 16, 1997
Sold by
Richmond Robert L and Richmond B L
Bought by
Richmond Robert L and Richmond Betty L
Create a Home Valuation Report for This Property
The Home Valuation Report is an in-depth analysis detailing your home's value as well as a comparison with similar homes in the area
Home Values in the Area
Average Home Value in this Area
Purchase History
| Date | Buyer | Sale Price | Title Company |
|---|---|---|---|
| Kumar Family Trust | -- | None Listed On Document | |
| Kumar Ajay | $295,000 | Old Republic Title Company | |
| Monetti David A | $230,000 | Chicago Title Co | |
| Richmond Robert L | -- | -- |
Source: Public Records
Mortgage History
| Date | Status | Borrower | Loan Amount |
|---|---|---|---|
| Previous Owner | Monetti David A | $172,500 |
Source: Public Records
Tax History Compared to Growth
Tax History
| Year | Tax Paid | Tax Assessment Tax Assessment Total Assessment is a certain percentage of the fair market value that is determined by local assessors to be the total taxable value of land and additions on the property. | Land | Improvement |
|---|---|---|---|---|
| 2025 | $4,093 | $354,536 | $240,366 | $114,170 |
| 2024 | $3,771 | $347,585 | $235,653 | $111,932 |
| 2023 | $3,713 | $340,771 | $231,033 | $109,738 |
| 2022 | $3,638 | $334,090 | $226,503 | $107,587 |
| 2021 | $3,595 | $327,540 | $222,062 | $105,478 |
| 2020 | $3,572 | $324,183 | $219,786 | $104,397 |
| 2019 | $3,516 | $317,827 | $215,477 | $102,350 |
| 2018 | $3,457 | $311,596 | $211,252 | $100,344 |
| 2017 | $3,284 | $305,487 | $207,110 | $98,377 |
| 2016 | $3,325 | $299,499 | $203,050 | $96,449 |
| 2014 | -- | $294,129 | $179,035 | $115,094 |
Source: Public Records
Map
Nearby Homes
- 546 W Grant Line Rd
- 2192 Wildflower Ct
- 111 W 23rd St
- 110 W 23rd St
- 2254 Morningside Ct Unit 42
- 2214 Morningside Ct
- 930 Plantation Ct
- 3054 Coventry Dr
- 2840-2896 Holly Dr
- 971 Plantation Ct
- 41 W Kavanagh Ave
- 80 Portola Way Unit 104
- 80 Portola Way Unit 105
- 262 W Lowell Ave
- 16 Pereira Ave
- 242 W Lowell Ave
- 228 W Lowell Ave
- 2613 Balboa Dr
- 1263 Johnson Ct
- 1792 Chester Dr
- 2336 Bessie Ave
- 2330 Bessie Ave
- 430 W Grant Line Rd
- 2320 Bessie Ave
- 404 W Grant Line Rd
- 2318 Bessie Ave
- 453 W 23rd St
- 441 W 23rd St
- 504 W Grant Line Rd
- 429 W 23rd St
- 417 W 23rd St
- 405 W 23rd St
- 344 W Grant Line Rd
- 508 W Grant Line Rd
- 475 W Grant Line Rd
- 389 W 23rd St
- 522 W Grant Line Rd
- 450 W 23rd St
- 438 W 23rd St
- 462 W 23rd St