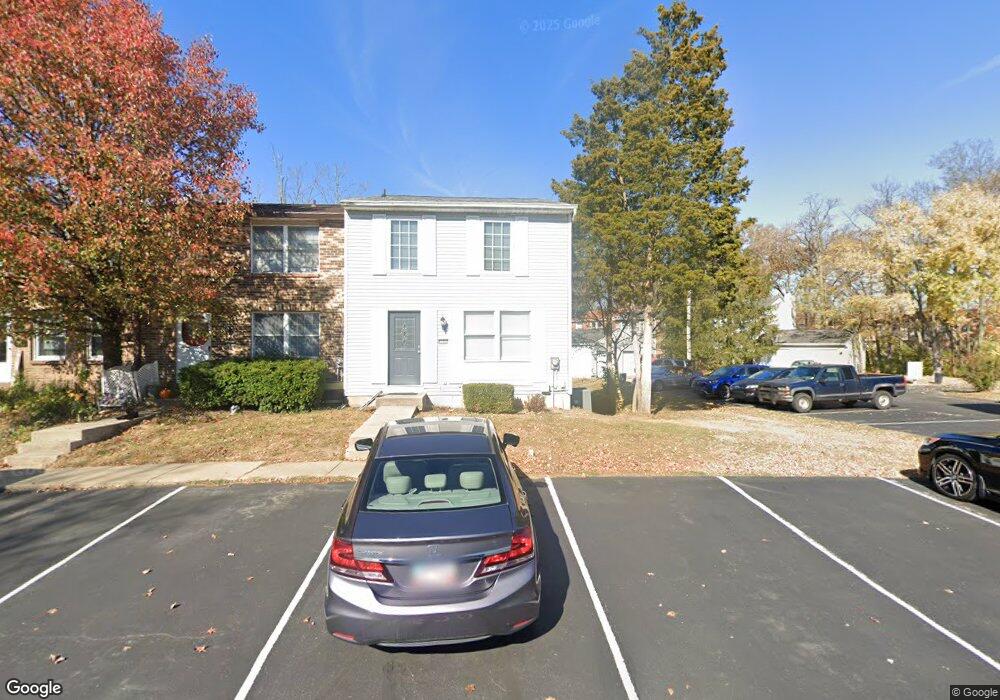
4500 New Market Ct Batavia, OH 45103
Estimated Value: $171,923 - $238,000
4
Beds
3
Baths
1,240
Sq Ft
$165/Sq Ft
Est. Value
About This Home
This home is located at 4500 New Market Ct, Batavia, OH 45103 and is currently estimated at $204,731, approximately $165 per square foot. 4500 New Market Ct is a home located in Clermont County with nearby schools including Willowville Elementary School, West Clermont Middle School, and West Clermont High School.
Ownership History
Date
Name
Owned For
Owner Type
Purchase Details
Closed on
Mar 27, 2019
Sold by
Hughes Ryan
Bought by
Barrett Kimberly S
Current Estimated Value
Home Financials for this Owner
Home Financials are based on the most recent Mortgage that was taken out on this home.
Original Mortgage
$99,750
Outstanding Balance
$87,698
Interest Rate
4.3%
Mortgage Type
Future Advance Clause Open End Mortgage
Estimated Equity
$117,033
Purchase Details
Closed on
Feb 20, 2009
Sold by
Peters Daniel W and Peters Jill L
Bought by
Hughes Ryan
Home Financials for this Owner
Home Financials are based on the most recent Mortgage that was taken out on this home.
Original Mortgage
$95,243
Interest Rate
5.2%
Mortgage Type
FHA
Purchase Details
Closed on
Aug 12, 2005
Sold by
Melvin Daniel E and Melvin Diane J
Bought by
Peters Daniel W and Peters Jill L
Home Financials for this Owner
Home Financials are based on the most recent Mortgage that was taken out on this home.
Original Mortgage
$75,835
Interest Rate
5.82%
Mortgage Type
Fannie Mae Freddie Mac
Purchase Details
Closed on
Feb 15, 1994
Purchase Details
Closed on
Jul 1, 1985
Create a Home Valuation Report for This Property
The Home Valuation Report is an in-depth analysis detailing your home's value as well as a comparison with similar homes in the area
Home Values in the Area
Average Home Value in this Area
Purchase History
| Date | Buyer | Sale Price | Title Company |
|---|---|---|---|
| Barrett Kimberly S | $105,000 | American Mortgage Service Co | |
| Hughes Ryan | $97,000 | Chase Legal Title Llc | |
| Peters Daniel W | $92,800 | Vintage Title Agency Inc | |
| -- | $56,900 | -- | |
| -- | $47,000 | -- |
Source: Public Records
Mortgage History
| Date | Status | Borrower | Loan Amount |
|---|---|---|---|
| Open | Barrett Kimberly S | $99,750 | |
| Previous Owner | Hughes Ryan | $95,243 | |
| Previous Owner | Peters Daniel W | $75,835 |
Source: Public Records
Tax History Compared to Growth
Tax History
| Year | Tax Paid | Tax Assessment Tax Assessment Total Assessment is a certain percentage of the fair market value that is determined by local assessors to be the total taxable value of land and additions on the property. | Land | Improvement |
|---|---|---|---|---|
| 2024 | $2,235 | $44,310 | $7,490 | $36,820 |
| 2023 | $2,238 | $44,310 | $7,490 | $36,820 |
| 2022 | $1,689 | $28,980 | $4,900 | $24,080 |
| 2021 | $1,696 | $28,980 | $4,900 | $24,080 |
| 2020 | $1,697 | $28,980 | $4,900 | $24,080 |
| 2019 | $1,427 | $28,490 | $2,030 | $26,460 |
| 2018 | $1,442 | $28,490 | $2,030 | $26,460 |
| 2017 | $1,461 | $28,490 | $2,030 | $26,460 |
| 2016 | $1,384 | $24,750 | $1,750 | $23,000 |
| 2015 | $1,342 | $24,750 | $1,750 | $23,000 |
| 2014 | $1,342 | $24,750 | $1,750 | $23,000 |
| 2013 | $1,303 | $23,770 | $1,650 | $22,120 |
Source: Public Records
Map
Nearby Homes
- 4536 Treeview Ct
- 4601 Shephard Rd
- 4536 Tealtown Rd
- 1016 Glen Este Ln
- 4597 Muirridge Ct
- 994 Shephard Woods Ct
- 4713 Shephard Rd
- 11 Spotswood Common Unit 1705
- 1165 Village Glen Dr
- 4450 Schoolhouse Rd
- 864 Tall Trees Dr
- 4503 Eva Ln
- 4449 Glendale Dr
- 1202 Lismore Dr
- 4455 Dogwood Dr
- 4420 Dogwood Dr
- 1079 Kensington Ln
- 4466 Eva Ln
- 1069 Crisfield Dr
- 4579 Wood Forest Ln
- 4502 New Market Ct
- 4506 New Market Ct
- 4512 New Market Ct
- 4510 New Market Ct
- 4514 New Market Ct
- 4514 New Market Ct
- 4516 New Market Ct
- 4508 New Market Ct
- 4508 New Market Ct
- 4518 New Market Ct
- 4549 Market Ct
- 4534 New Market Ct
- 4551 New Market Ct
- 4532 New Market Ct
- 4532 New Market Ct
- 4530 New Market Ct
- 4549 New Market Ct
- 4549 New Market Ct
- 4528 New Market Ct
- 4520 New Market Ct