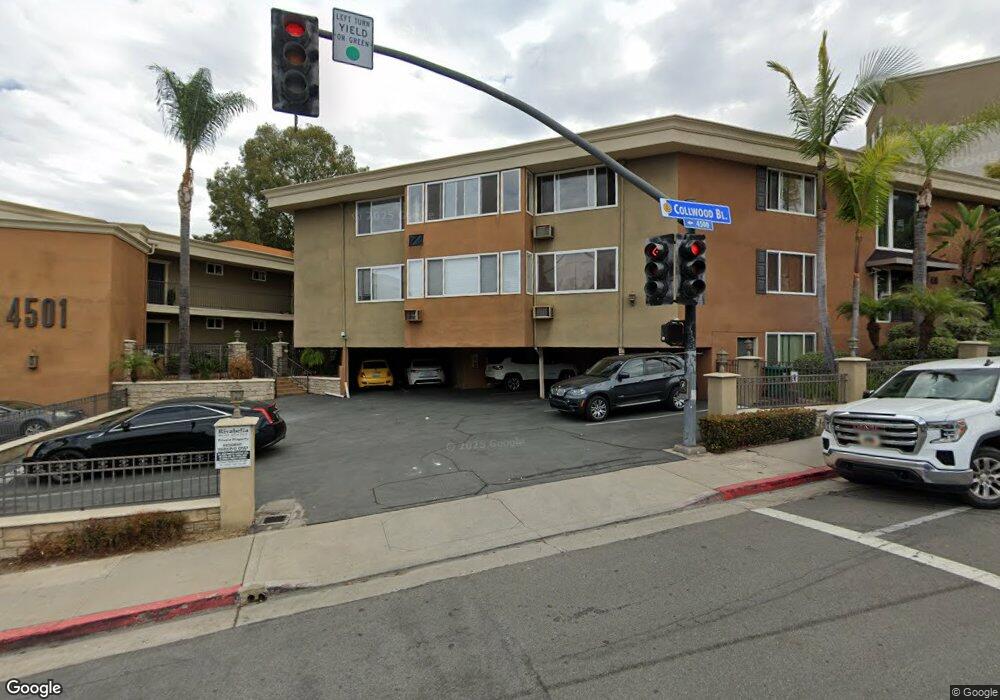
4501 Collwood Blvd Unit 6 San Diego, CA 92115
College West NeighborhoodEstimated Value: $355,000 - $395,000
1
Bed
1
Bath
686
Sq Ft
$542/Sq Ft
Est. Value
About This Home
This home is located at 4501 Collwood Blvd Unit 6, San Diego, CA 92115 and is currently estimated at $371,582, approximately $541 per square foot. 4501 Collwood Blvd Unit 6 is a home located in San Diego County with nearby schools including Fay Elementary School, Mann Middle School, and Crawford High School.
Ownership History
Date
Name
Owned For
Owner Type
Purchase Details
Closed on
Dec 23, 2010
Sold by
Woodford Vilma
Bought by
Woodford Vilma
Current Estimated Value
Purchase Details
Closed on
Jun 18, 2010
Sold by
Federal Home Loan Mortgage Corporation
Bought by
Woodford Vilma
Purchase Details
Closed on
Aug 21, 2009
Sold by
Glorioso Anthony D and Davis Ruth
Bought by
Federal Home Loan Mortgage Corporation
Purchase Details
Closed on
May 6, 2005
Sold by
Collwood Coastal Llc
Bought by
Glorioso Anthony D
Home Financials for this Owner
Home Financials are based on the most recent Mortgage that was taken out on this home.
Original Mortgage
$259,990
Interest Rate
6.8%
Mortgage Type
New Conventional
Create a Home Valuation Report for This Property
The Home Valuation Report is an in-depth analysis detailing your home's value as well as a comparison with similar homes in the area
Home Values in the Area
Average Home Value in this Area
Purchase History
| Date | Buyer | Sale Price | Title Company |
|---|---|---|---|
| Woodford Vilma | -- | None Available | |
| Woodford Vilma | $106,000 | Ticor Title Riverside | |
| Federal Home Loan Mortgage Corporation | $105,000 | Accommodation | |
| Glorioso Anthony D | $260,000 | Chicago Title Co |
Source: Public Records
Mortgage History
| Date | Status | Borrower | Loan Amount |
|---|---|---|---|
| Previous Owner | Glorioso Anthony D | $259,990 |
Source: Public Records
Tax History Compared to Growth
Tax History
| Year | Tax Paid | Tax Assessment Tax Assessment Total Assessment is a certain percentage of the fair market value that is determined by local assessors to be the total taxable value of land and additions on the property. | Land | Improvement |
|---|---|---|---|---|
| 2025 | $1,581 | $135,794 | $67,897 | $67,897 |
| 2024 | $1,581 | $133,132 | $66,566 | $66,566 |
| 2023 | $1,544 | $130,522 | $65,261 | $65,261 |
| 2022 | $1,502 | $127,964 | $63,982 | $63,982 |
| 2021 | $1,490 | $125,456 | $62,728 | $62,728 |
| 2020 | $1,471 | $124,170 | $62,085 | $62,085 |
| 2019 | $1,444 | $121,736 | $60,868 | $60,868 |
| 2018 | $1,350 | $119,350 | $59,675 | $59,675 |
| 2017 | $83 | $117,010 | $58,505 | $58,505 |
| 2016 | $1,293 | $114,716 | $57,358 | $57,358 |
| 2015 | $1,273 | $112,994 | $56,497 | $56,497 |
| 2014 | $1,252 | $110,782 | $55,391 | $55,391 |
Source: Public Records
Map
Nearby Homes
- 4501 Collwood Blvd Unit 4
- 4501 Collwood Blvd Unit 9
- 4545 Collwood Blvd Unit 27
- 4545 Collwood Blvd Unit 19
- 4570 54th St Unit 208
- 4527 Contour Blvd Unit 8
- 4547 Contour Blvd
- 4554 Contour Blvd
- 4514 Dawson Ave Unit 4
- 4514 Dawson Ave Unit 2
- 5460 Gilbert Dr
- 4462 52nd St
- 4704 Austin Dr
- 4437 51st St Unit 3
- 4521 55th St Unit 15
- 4472-74 51st St
- 4737 Baylor Dr
- 4310 54th St Unit 105
- 5510 Adelaide Ave Unit 1
- 5511 Adelaide Ave Unit 29
- 4501 Collwood Blvd Unit 22
- 4501 Collwood Blvd Unit 20
- 4501 Collwood Blvd Unit 19
- 4501 Collwood Blvd Unit 18
- 4501 Collwood Blvd Unit 16
- 4501 Collwood Blvd Unit 14
- 4501 Collwood Blvd Unit 13
- 4501 Collwood Blvd Unit 10
- 4501 Collwood Blvd Unit 8
- 4501 Collwood Blvd Unit 21
- 4501 Collwood Blvd Unit 7
- 4501 Collwood Blvd Unit 2
- 4501 Collwood Blvd Unit 5
- 4501 Collwood Blvd Unit 3
- 4501 Collwood Blvd Unit 1
- 4501 Collwood Blvd Unit 12
- 4501 Collwood Blvd Unit 17
- 4530 54th St
- 4545 Collwood Blvd Unit 45
- 4545 Collwood Blvd Unit 8