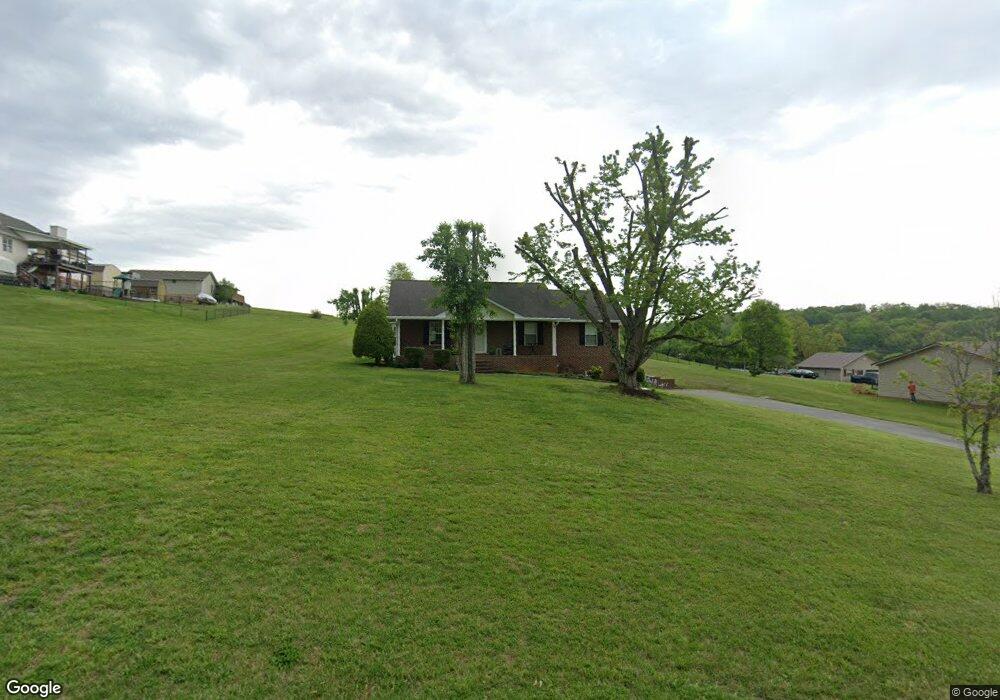
4501 Holly Tree Ln Morristown, TN 37814
Estimated Value: $305,675 - $380,000
--
Bed
2
Baths
1,504
Sq Ft
$231/Sq Ft
Est. Value
About This Home
This home is located at 4501 Holly Tree Ln, Morristown, TN 37814 and is currently estimated at $347,419, approximately $230 per square foot. 4501 Holly Tree Ln is a home located in Hamblen County with nearby schools including Manley Elementary School, West View Middle School, and Morristown West High School.
Ownership History
Date
Name
Owned For
Owner Type
Purchase Details
Closed on
Nov 27, 2000
Sold by
Thomas Hodges Charles
Bought by
Williams Ralph B
Current Estimated Value
Home Financials for this Owner
Home Financials are based on the most recent Mortgage that was taken out on this home.
Original Mortgage
$106,900
Outstanding Balance
$39,734
Interest Rate
7.82%
Estimated Equity
$307,685
Purchase Details
Closed on
Feb 6, 1997
Bought by
Hodges Charles Thomas Albert and Hodges Rebecca M
Purchase Details
Closed on
Apr 2, 1996
Sold by
Bell Hubert J
Bought by
Smelcer Richard
Purchase Details
Closed on
Jun 10, 1992
Bought by
Bell Hubert J
Purchase Details
Closed on
Mar 23, 1990
Bought by
Bell John D
Purchase Details
Closed on
Nov 3, 1988
Bought by
Smallman Glenn H
Purchase Details
Closed on
Mar 4, 1938
Bought by
Smallman Glenn H
Create a Home Valuation Report for This Property
The Home Valuation Report is an in-depth analysis detailing your home's value as well as a comparison with similar homes in the area
Home Values in the Area
Average Home Value in this Area
Purchase History
| Date | Buyer | Sale Price | Title Company |
|---|---|---|---|
| Williams Ralph B | $126,900 | -- | |
| Hodges Charles Thomas Albert | $96,000 | -- | |
| Smelcer Richard | $14,000 | -- | |
| Bell Hubert J | -- | -- | |
| Bell John D | -- | -- | |
| Smallman Glenn H | -- | -- | |
| Smallman Glenn H | -- | -- |
Source: Public Records
Mortgage History
| Date | Status | Borrower | Loan Amount |
|---|---|---|---|
| Open | Smallman Glenn H | $106,900 |
Source: Public Records
Tax History Compared to Growth
Tax History
| Year | Tax Paid | Tax Assessment Tax Assessment Total Assessment is a certain percentage of the fair market value that is determined by local assessors to be the total taxable value of land and additions on the property. | Land | Improvement |
|---|---|---|---|---|
| 2024 | $833 | $42,300 | $6,175 | $36,125 |
| 2023 | $833 | $42,300 | $0 | $0 |
| 2022 | $833 | $42,300 | $6,175 | $36,125 |
| 2021 | $833 | $42,300 | $6,175 | $36,125 |
| 2020 | $833 | $42,300 | $6,175 | $36,125 |
| 2019 | $828 | $38,875 | $5,925 | $32,950 |
| 2018 | $828 | $38,875 | $5,925 | $32,950 |
| 2017 | $828 | $38,875 | $5,925 | $32,950 |
| 2016 | $774 | $38,875 | $5,925 | $32,950 |
| 2015 | $719 | $38,875 | $5,925 | $32,950 |
| 2014 | -- | $38,875 | $5,925 | $32,950 |
| 2013 | -- | $43,750 | $0 | $0 |
Source: Public Records
Map
Nearby Homes
- 1121 Hickory View Dr
- 1074 Hickory View Dr
- 1013 Shadow Wood Ln
- 1465 Wind Crest Dr
- 1025 Hickory View Dr
- 1031 Hickory View Dr
- 1406 Dandelion Cir
- 4193 Scarlett Dr
- 1466 Dandelion Cir
- 4537 Horseshoe Trail
- 4562 Horseshoe Trail
- 5254 Rolling Springs Dr
- 715* Benjamin Blvd
- 1115 Millrace Rd
- 1019 Ashley Ct
- 1540 Kidwell Ridge Rd
- 621 Benjamin Blvd
- 615 Benjamin Blvd
- 623 Landen Cir
- 994 Pinewood Cir
- 4507 Holly Tree Ln
- 4451 Holly Tree Ln
- 1121 Murrell Rd
- 4500 Holly Tree Ln
- 4513 Holly Tree Ln
- 4437 Holly Tree Ln
- 4508 Holly Tree Ln
- 4492 Holly Tree Ln
- 4425 Holly Tree Ln
- 4519 Holly Tree Ln
- 1111 Murrell Rd
- 4514 Holly Tree Ln
- 4456 Holly Tree Ln
- 1082 Shadow Wood Ln
- 1151 Murrell Rd
- 4480 Holly Tree Ln
- 4468 Holly Tree Ln
- 1161 Murrell Rd
- 4440 Holly Tree Ln
- 1090 Shadow Wood Ln