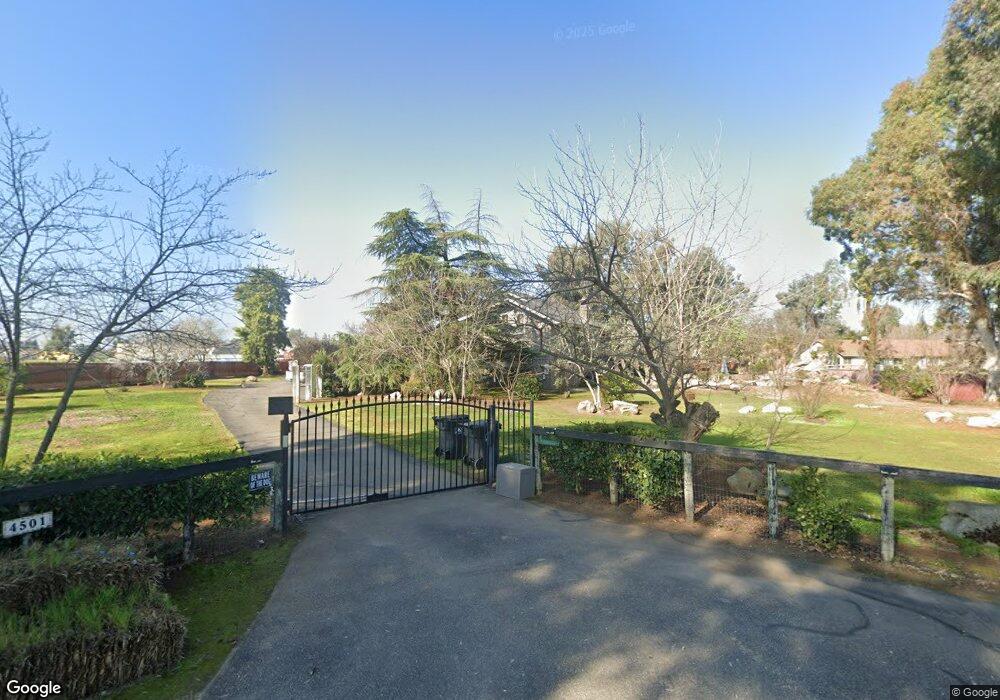
4501 N Whitner Ave Sanger, CA 93657
Estimated Value: $1,023,000 - $1,235,000
4
Beds
3
Baths
4,209
Sq Ft
$259/Sq Ft
Est. Value
About This Home
This home is located at 4501 N Whitner Ave, Sanger, CA 93657 and is currently estimated at $1,091,228, approximately $259 per square foot. 4501 N Whitner Ave is a home located in Fresno County with nearby schools including Fairmont Elementary School, Washington Academic Middle School, and Sanger High School.
Ownership History
Date
Name
Owned For
Owner Type
Purchase Details
Closed on
Sep 20, 2017
Sold by
Clarke Anzaldua Christy L
Bought by
Anzaldua Christy
Current Estimated Value
Purchase Details
Closed on
Apr 10, 2012
Sold by
Clarke Anzaldua Christy L and Clarke Christy L
Bought by
Clarke Anzaldua Christy L and Anzaldua Homero
Home Financials for this Owner
Home Financials are based on the most recent Mortgage that was taken out on this home.
Original Mortgage
$285,000
Outstanding Balance
$38,381
Interest Rate
3.84%
Mortgage Type
New Conventional
Estimated Equity
$1,052,847
Purchase Details
Closed on
Jan 22, 2010
Sold by
Anzaldua Homero
Bought by
Clarke Christy L
Home Financials for this Owner
Home Financials are based on the most recent Mortgage that was taken out on this home.
Original Mortgage
$326,240
Interest Rate
5.03%
Mortgage Type
New Conventional
Purchase Details
Closed on
Dec 30, 2009
Sold by
Wells Fargo Bank Na
Bought by
Clarke Christy L
Home Financials for this Owner
Home Financials are based on the most recent Mortgage that was taken out on this home.
Original Mortgage
$326,240
Interest Rate
5.03%
Mortgage Type
New Conventional
Purchase Details
Closed on
Oct 2, 2009
Sold by
Silva Marybelle
Bought by
Wachovia Mortgage Fsb
Purchase Details
Closed on
Jun 1, 2006
Sold by
Luna Julian
Bought by
Silva Marybelle
Home Financials for this Owner
Home Financials are based on the most recent Mortgage that was taken out on this home.
Original Mortgage
$588,000
Interest Rate
6.52%
Mortgage Type
Stand Alone First
Purchase Details
Closed on
Apr 11, 2006
Sold by
Clark Bryan T and Isabell Brian K
Bought by
Silva Marybelle
Home Financials for this Owner
Home Financials are based on the most recent Mortgage that was taken out on this home.
Original Mortgage
$588,000
Interest Rate
6.52%
Mortgage Type
Stand Alone First
Purchase Details
Closed on
Dec 14, 2001
Sold by
Rosetti Daniel C and Rosetti Diane
Bought by
Clark Bryan T and Isbell Brian K
Home Financials for this Owner
Home Financials are based on the most recent Mortgage that was taken out on this home.
Original Mortgage
$300,700
Interest Rate
7.11%
Purchase Details
Closed on
Jun 10, 1998
Sold by
Rosetti Daniel C
Bought by
Rosetti Daniel C and Rosetti Diane
Home Financials for this Owner
Home Financials are based on the most recent Mortgage that was taken out on this home.
Original Mortgage
$110,000
Interest Rate
7.17%
Create a Home Valuation Report for This Property
The Home Valuation Report is an in-depth analysis detailing your home's value as well as a comparison with similar homes in the area
Home Values in the Area
Average Home Value in this Area
Purchase History
| Date | Buyer | Sale Price | Title Company |
|---|---|---|---|
| Anzaldua Christy | -- | None Available | |
| Clarke Anzaldua Christy L | -- | Chicago Title Company | |
| Clarke Christy L | -- | Chicago Title Company | |
| Clarke Christy L | $408,000 | Chicago Title Company | |
| Wachovia Mortgage Fsb | $494,271 | Stewart Title | |
| Silva Marybelle | -- | Fidelity National Title Co | |
| Silva Marybelle | $840,000 | Fidelity National Title Co | |
| Clark Bryan T | $383,000 | Fidelity National Title Co | |
| Rosetti Daniel C | -- | Commonwealth Land Title Ins | |
| Rosetti Daniel C | -- | Commonwealth Land Title Ins |
Source: Public Records
Mortgage History
| Date | Status | Borrower | Loan Amount |
|---|---|---|---|
| Open | Clarke Anzaldua Christy L | $285,000 | |
| Closed | Clarke Christy L | $326,240 | |
| Previous Owner | Silva Marybelle | $588,000 | |
| Previous Owner | Clark Bryan T | $300,700 | |
| Previous Owner | Rosetti Daniel C | $110,000 | |
| Closed | Clark Bryan T | $63,150 |
Source: Public Records
Tax History Compared to Growth
Tax History
| Year | Tax Paid | Tax Assessment Tax Assessment Total Assessment is a certain percentage of the fair market value that is determined by local assessors to be the total taxable value of land and additions on the property. | Land | Improvement |
|---|---|---|---|---|
| 2025 | $6,283 | $526,003 | $193,619 | $332,384 |
| 2023 | $6,204 | $505,579 | $186,101 | $319,478 |
| 2022 | $6,109 | $495,666 | $182,452 | $313,214 |
| 2021 | $6,060 | $485,948 | $178,875 | $307,073 |
| 2020 | $5,881 | $480,966 | $177,041 | $303,925 |
| 2019 | $5,761 | $471,536 | $173,570 | $297,966 |
| 2018 | $5,519 | $462,291 | $170,167 | $292,124 |
| 2017 | $5,341 | $453,228 | $166,831 | $286,397 |
| 2016 | $4,933 | $437,166 | $160,917 | $276,249 |
| 2015 | $4,973 | $430,600 | $158,500 | $272,100 |
| 2014 | $4,681 | $403,300 | $148,500 | $254,800 |
Source: Public Records
Map
Nearby Homes
- 5373 N Mendocino Ave
- 1 N Kittyhawk Ave
- 13480 E Ashlan Ave
- 13925 E Shaw Ave
- 12743 E Gettysburg Ave
- 12804 E Alamos Ave
- 5496 S Newmark
- 12000 E Shaw Ave
- 12740 E Robinson Ave
- 12602 E Robinson Ave
- 13545 E Bullard Ave
- 5476 Greenwood Ave
- 3520 N Bethel Ave
- 11722 E Ashlan Ave
- 12741 E Paul Ave
- 12462 E Clinton Ave
- 15660 E Griffith Ave
- 11335 E Ashlan Ave
- 2383 N Greenwood Ave
- 4626 N Arrow Ridge Way
- 4537 N Whitner Ave
- 13567 E Rialto Ave
- 13531 E Gettysburg Ave
- 4502 N Whitner Ave
- 4554 N Whitner Ave
- 4536 N Mendocino Ave
- 13503 E Rialto Ave
- 13594 E Rialto Ave
- 13558 E Rialto Ave
- 13663 E Rialto Ave
- 13445 E Rialto Ave
- 13457 E Gettysburg Ave
- 13701 E Gettysburg Ave
- 13526 E Rialto Ave
- 13618 E Rialto Ave
- 4511 N Mendocino Ave
- 13650 E Rialto Ave
- 13707 E Rialto Ave
- 4535 N Mendocino Ave
- 13627 E Gettysburg Ave