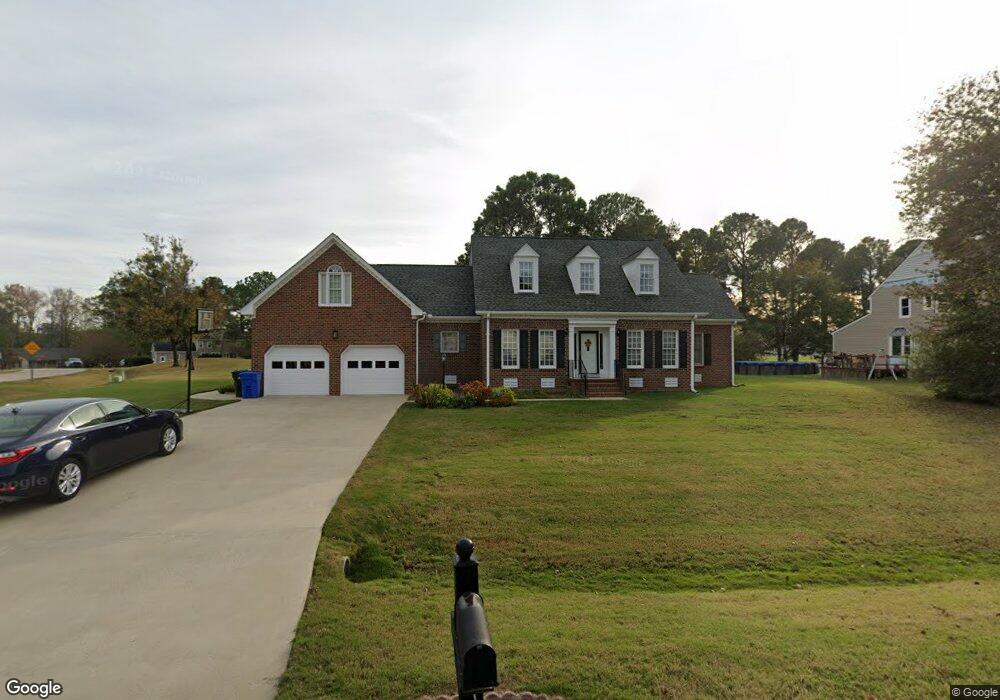
4501 Saint Andrews Cir N Wilson, NC 27896
Estimated Value: $393,000 - $442,000
3
Beds
3
Baths
2,794
Sq Ft
$152/Sq Ft
Est. Value
About This Home
This home is located at 4501 Saint Andrews Cir N, Wilson, NC 27896 and is currently estimated at $424,248, approximately $151 per square foot. 4501 Saint Andrews Cir N is a home located in Wilson County with nearby schools including New Hope Elementary School, Elm City Middle School, and Fike High School.
Create a Home Valuation Report for This Property
The Home Valuation Report is an in-depth analysis detailing your home's value as well as a comparison with similar homes in the area
Home Values in the Area
Average Home Value in this Area
Tax History Compared to Growth
Tax History
| Year | Tax Paid | Tax Assessment Tax Assessment Total Assessment is a certain percentage of the fair market value that is determined by local assessors to be the total taxable value of land and additions on the property. | Land | Improvement |
|---|---|---|---|---|
| 2025 | $4,735 | $422,734 | $75,000 | $347,734 |
| 2024 | $4,735 | $422,734 | $75,000 | $347,734 |
| 2023 | $3,776 | $289,378 | $75,000 | $214,378 |
| 2022 | $3,776 | $289,378 | $75,000 | $214,378 |
| 2021 | $3,776 | $289,378 | $75,000 | $214,378 |
| 2020 | $3,776 | $289,378 | $75,000 | $214,378 |
| 2019 | $3,776 | $289,378 | $75,000 | $214,378 |
| 2018 | $3,776 | $287,999 | $75,000 | $212,999 |
| 2017 | $3,701 | $287,999 | $75,000 | $212,999 |
| 2016 | $3,701 | $287,999 | $75,000 | $212,999 |
| 2014 | $3,506 | $281,637 | $75,000 | $206,637 |
Source: Public Records
Map
Nearby Homes
- 4500 Saint Andrews Dr N
- 4401 Country Club Dr N
- 4506 Saint Andrews Dr N
- 4702 Nash St N
- 4710 Burning Tree Ln N
- 4322 Fawn Ct N
- 4800 Burning Tree Ln N
- 4014 Townes Ct
- 4206 Nantucket Dr NW
- 3902 Redbay Ln
- 4511 Bobwhite Trail N
- 5317 Solaris Dr
- 3645 Eagle Farm Dr N
- 5010 Country Club Dr N
- 3610 Arrowwood Dr N
- 4121 Little John Dr N
- 4915 Country Club Dr N
- 4102 Huntsmoor Ln
- 4008 Huntsmoor Ln
- 3556 Jetstream Dr
- 4501 Saint Andrews Dr N
- 4404 Saint Andrews Dr N
- 4503 St Andrews Cir
- 4503 Saint Andrews Cir N
- 4502 St Andrews Cir
- 4502 To Be Added
- 4503 Saint Andrews Dr N
- 4505 Saint Andrews Cir N
- 4502 Saint Andrews Cir N
- 4502 Saint Andrews Dr N
- 4504 Saint Andrews Cir N
- 4504 Saint Andrews Dr N
- 4321 Country Club Dr N
- 4403 Country Club Dr N
- 4319 Country Club Dr N
- 4319 Country Club Dr N
- 4505 Saint Andrews Dr N
- 4405 Country Club Dr N
- 4317 Country Club Dr N
- 4509 Saint Andrews Dr N