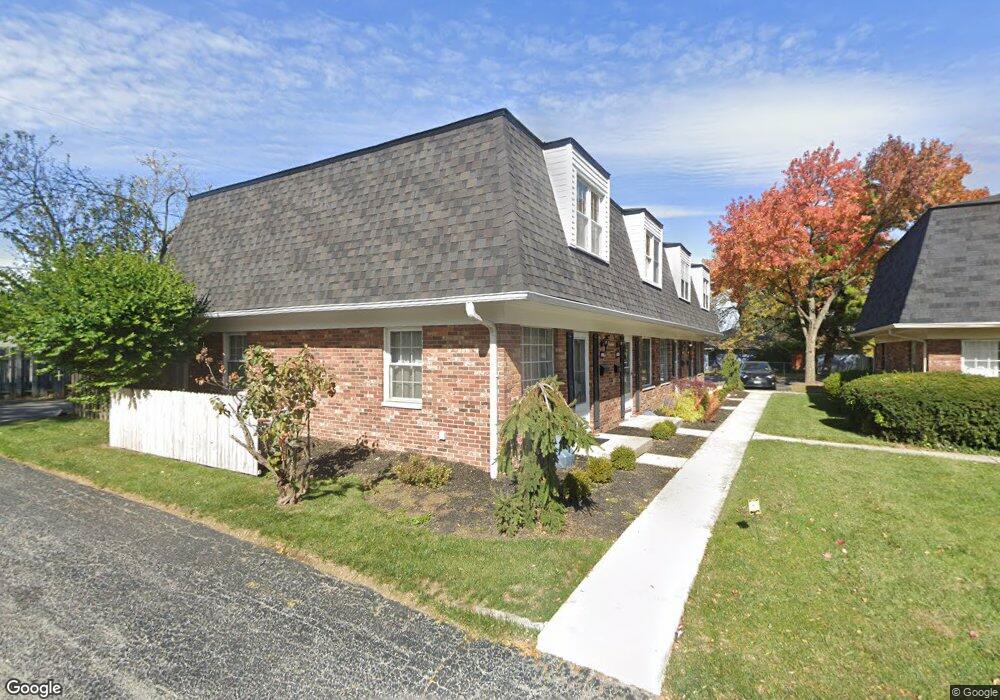
4503 Folkestone Ct N Unit 12-B Columbus, OH 43220
Kendale NeighborhoodEstimated Value: $174,000 - $202,000
2
Beds
2
Baths
928
Sq Ft
$205/Sq Ft
Est. Value
About This Home
This home is located at 4503 Folkestone Ct N Unit 12-B, Columbus, OH 43220 and is currently estimated at $190,263, approximately $205 per square foot. 4503 Folkestone Ct N Unit 12-B is a home located in Franklin County with nearby schools including Winterset Elementary School, Ridgeview Middle School, and Centennial High School.
Ownership History
Date
Name
Owned For
Owner Type
Purchase Details
Closed on
Nov 12, 2015
Sold by
Rose Duane A and Rose Ana M
Bought by
Mcginnis Kerry S
Current Estimated Value
Home Financials for this Owner
Home Financials are based on the most recent Mortgage that was taken out on this home.
Original Mortgage
$89,900
Outstanding Balance
$70,687
Interest Rate
3.78%
Mortgage Type
New Conventional
Estimated Equity
$119,576
Purchase Details
Closed on
Mar 8, 2013
Sold by
Smiley James J
Bought by
Rose Duane A and Rose Ana M
Purchase Details
Closed on
May 1, 2009
Sold by
Calland Kelly R
Bought by
Smiley James J
Home Financials for this Owner
Home Financials are based on the most recent Mortgage that was taken out on this home.
Original Mortgage
$80,514
Interest Rate
4.83%
Mortgage Type
FHA
Purchase Details
Closed on
Jun 1, 1986
Create a Home Valuation Report for This Property
The Home Valuation Report is an in-depth analysis detailing your home's value as well as a comparison with similar homes in the area
Home Values in the Area
Average Home Value in this Area
Purchase History
| Date | Buyer | Sale Price | Title Company |
|---|---|---|---|
| Mcginnis Kerry S | $99,000 | None Available | |
| Rose Duane A | $87,000 | None Available | |
| Smiley James J | $82,000 | Attorney | |
| -- | $44,900 | -- |
Source: Public Records
Mortgage History
| Date | Status | Borrower | Loan Amount |
|---|---|---|---|
| Open | Mcginnis Kerry S | $89,900 | |
| Previous Owner | Smiley James J | $80,514 |
Source: Public Records
Tax History Compared to Growth
Tax History
| Year | Tax Paid | Tax Assessment Tax Assessment Total Assessment is a certain percentage of the fair market value that is determined by local assessors to be the total taxable value of land and additions on the property. | Land | Improvement |
|---|---|---|---|---|
| 2024 | $2,482 | $55,310 | $8,230 | $47,080 |
| 2023 | $2,451 | $55,300 | $8,225 | $47,075 |
| 2022 | $2,002 | $38,610 | $6,860 | $31,750 |
| 2021 | $2,006 | $38,610 | $6,860 | $31,750 |
| 2020 | $2,009 | $38,610 | $6,860 | $31,750 |
| 2019 | $1,673 | $27,580 | $4,900 | $22,680 |
| 2018 | $1,719 | $27,580 | $4,900 | $22,680 |
| 2017 | $1,672 | $27,580 | $4,900 | $22,680 |
| 2016 | $1,948 | $29,410 | $5,150 | $24,260 |
| 2015 | $1,769 | $29,410 | $5,150 | $24,260 |
| 2014 | $1,773 | $29,410 | $5,150 | $24,260 |
| 2013 | $832 | $28,000 | $4,900 | $23,100 |
Source: Public Records
Map
Nearby Homes
- 1033 Folkestone Rd
- 4326 Kenny Rd
- 4710 Charecote Ln Unit D
- 1046 Merrimar Cir N Unit B
- 4271 Kenbury Place
- 1030 Galliton Ct Unit B
- 4543 Ducrest Dr
- 4160 Ruxton Ln
- 4818 -4820 Winterset Dr
- 1466 Weybridge Rd
- 1594 Lafayette Dr Unit 1594
- 1147 Langland Dr
- 1610 Lafayette Dr Unit 1610
- 1161 Bethel Rd Unit 103/104
- 652 Olde Towne Ave Unit 9-652E
- 652 Olde Towne Ave Unit 9-652 G
- 3845 Shattuck Ave
- 713 Marburn Dr
- 4924 Reed Rd Unit B
- 4094 Lyon Dr
- 4503 Folkestone Ct N Unit 12B
- 4503 Folkestone Ct N Unit B
- 4501 Folkestone Ct N
- 4505 Folkestone Ct N
- 4507 Folkestone Ct N Unit 12D
- 4507 Folkestone Ct N Unit D
- 4507 Folkestone Ct N Unit D
- 4506 Folkestone Ct N
- 1090 Folkestone Rd
- 1094 Folkestone Rd
- 1094 Folkestone Rd Unit 13-A
- 4510 Kenny Rd
- 1088 Folkestone Rd Unit D
- 4502 Folkestone Ct N Unit 10B
- 1100 Folkestone Rd
- 4500 Folkestone Ct N
- 4494 Folkestone Ct N
- 4504 Folkestone Ct N
- 4496 Folkestone Ct N
- 4496 Folkestone Ct N Unit 9-A