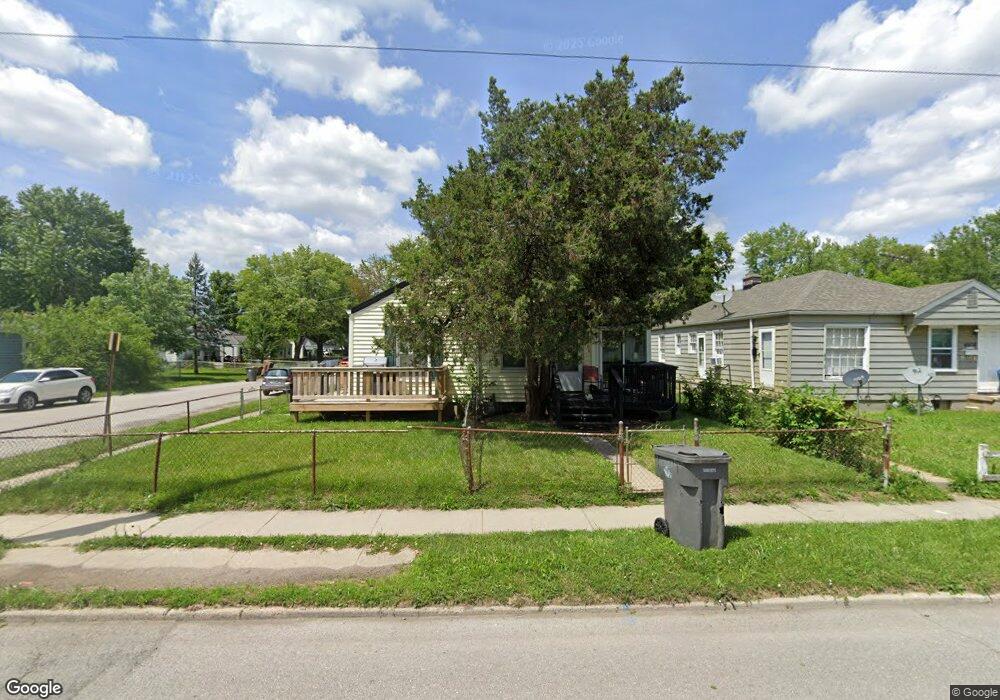
4504 E 16th St Indianapolis, IN 46201
Near Eastside NeighborhoodEstimated Value: $151,000
2
Beds
--
Bath
552
Sq Ft
$274/Sq Ft
Est. Value
About This Home
This home is located at 4504 E 16th St, Indianapolis, IN 46201 and is currently estimated at $151,000, approximately $273 per square foot. 4504 E 16th St is a home located in Marion County with nearby schools including Thomas D. Gregg School No. 15, Washington Irving School 14, and Anna Brochhausen School 88.
Ownership History
Date
Name
Owned For
Owner Type
Purchase Details
Closed on
Aug 9, 2021
Sold by
Davis Margie
Bought by
Davis Jimmy and Davis Roxana
Current Estimated Value
Purchase Details
Closed on
Jun 7, 2010
Sold by
Davis Jimmy and Davis Roxana
Bought by
Davis Margie
Purchase Details
Closed on
Sep 23, 2009
Sold by
First Horizon Home Loans
Bought by
Davis Jimmy and Davis Roxana
Purchase Details
Closed on
Sep 9, 2009
Sold by
Metlife Home Loans
Bought by
First Horizon Home Loans
Purchase Details
Closed on
Dec 24, 2008
Sold by
Reed Jerry O and First Horizon Home Loans
Bought by
Metlife Home Loan
Purchase Details
Closed on
Sep 1, 2005
Sold by
Riedeman John
Bought by
Reed Jerry O
Home Financials for this Owner
Home Financials are based on the most recent Mortgage that was taken out on this home.
Original Mortgage
$34,000
Interest Rate
7.12%
Mortgage Type
Adjustable Rate Mortgage/ARM
Create a Home Valuation Report for This Property
The Home Valuation Report is an in-depth analysis detailing your home's value as well as a comparison with similar homes in the area
Home Values in the Area
Average Home Value in this Area
Purchase History
| Date | Buyer | Sale Price | Title Company |
|---|---|---|---|
| Davis Jimmy | -- | None Available | |
| Davis Margie | -- | None Available | |
| Davis Jimmy | $15,763 | None Available | |
| First Horizon Home Loans | -- | None Available | |
| Metlife Home Loan | $21,250 | None Available | |
| Reed Jerry O | -- | None Available |
Source: Public Records
Mortgage History
| Date | Status | Borrower | Loan Amount |
|---|---|---|---|
| Previous Owner | Reed Jerry O | $34,000 |
Source: Public Records
Tax History
| Year | Tax Paid | Tax Assessment Tax Assessment Total Assessment is a certain percentage of the fair market value that is determined by local assessors to be the total taxable value of land and additions on the property. | Land | Improvement |
|---|---|---|---|---|
| 2024 | $1,657 | $64,800 | $7,000 | $57,800 |
| 2023 | $1,657 | $64,800 | $7,000 | $57,800 |
| 2022 | $1,549 | $60,600 | $7,000 | $53,600 |
| 2021 | $1,274 | $50,200 | $7,000 | $43,200 |
| 2020 | $1,154 | $44,900 | $2,700 | $42,200 |
| 2019 | $1,073 | $40,700 | $2,700 | $38,000 |
| 2018 | $1,295 | $49,700 | $2,700 | $47,000 |
| 2017 | $1,147 | $48,900 | $2,700 | $46,200 |
| 2016 | $1,121 | $48,800 | $2,700 | $46,100 |
| 2014 | $1,124 | $52,000 | $2,700 | $49,300 |
| 2013 | $1,081 | $52,000 | $2,700 | $49,300 |
Source: Public Records
Map
Nearby Homes
- 1618 N Linwood Ave
- 1616 N Euclid Ave
- 1521 N Euclid Ave
- 1709 N Euclid Ave
- 1717 N Euclid Ave
- 1526 N Euclid Ave
- 1521 N Gladstone Ave
- 1425 Shannon Ave
- 1424 Wallace Ave
- 1534 N Grant Ave
- 1424 N Gladstone Ave
- 1916 N Colorado Ave
- 1946 N Euclid Ave
- 1324 N Gladstone Ave
- 1518 N Chester Ave
- 4860 E 14th St
- 1434 N Chester Ave
- 1905 N Dequincy St
- 1318 N Grant Ave
- 2016 Glenridge Dr
- 4506 E 16th St
- 4510 E 16th St
- 1611 N Linwood Ave
- 4424 E 16th St
- 1609 N Linwood Ave
- 1617 N Linwood Ave
- 1608 N Linwood Ave
- 1621 N Linwood Ave
- 1543 Shannon Ave
- 1542 N Linwood Ave
- 4514 E 16th St
- 4420 E 16th St
- 4416 E 16th St
- 1625 N Linwood Ave
- 1539 Shannon Ave
- 4522 E 16th St
- 1556 Shannon Ave
- 1526 N Linwood Ave
- 1626 N Linwood Ave
- 4505 E 17th St