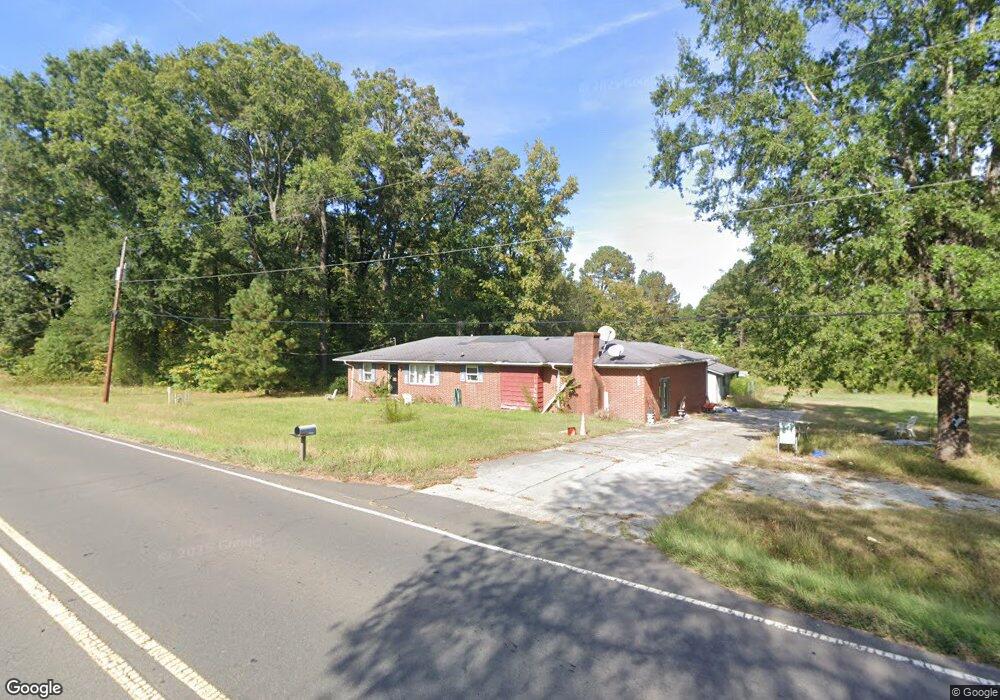
4504 Red Mill Rd Durham, NC 27704
Northeast Durham NeighborhoodEstimated Value: $322,000 - $393,000
4
Beds
2
Baths
2,203
Sq Ft
$163/Sq Ft
Est. Value
About This Home
This home is located at 4504 Red Mill Rd, Durham, NC 27704 and is currently estimated at $358,344, approximately $162 per square foot. 4504 Red Mill Rd is a home located in Durham County with nearby schools including Sandy Ridge Elementary School, Lucas Middle School, and Northern High School.
Ownership History
Date
Name
Owned For
Owner Type
Purchase Details
Closed on
Apr 4, 2014
Sold by
Fuller Frank Ben
Bought by
Fuller Frank Ben and Mccoy Stephanie Donita
Current Estimated Value
Purchase Details
Closed on
Nov 29, 2010
Sold by
Square Deal Llc
Bought by
Fuller Frank Ben and Sneed Annissianna Williams
Purchase Details
Closed on
Oct 8, 2010
Sold by
Secretary Of Housing & Urban Development
Bought by
Square Deal Llc
Purchase Details
Closed on
Mar 9, 2010
Sold by
Sandoval Jose A P and Polanco Nora G
Bought by
Secretary Of Housing & Urban Development
Purchase Details
Closed on
Nov 16, 2007
Sold by
Spencer Rhonda W and Spencer Richard M
Bought by
Polanco Sandoval Jose A
Purchase Details
Closed on
Oct 30, 2001
Sold by
Mayton Priscilla S
Bought by
Polanco Sandoval A and Polanco Nora
Home Financials for this Owner
Home Financials are based on the most recent Mortgage that was taken out on this home.
Original Mortgage
$130,000
Interest Rate
6.85%
Mortgage Type
Seller Take Back
Create a Home Valuation Report for This Property
The Home Valuation Report is an in-depth analysis detailing your home's value as well as a comparison with similar homes in the area
Home Values in the Area
Average Home Value in this Area
Purchase History
| Date | Buyer | Sale Price | Title Company |
|---|---|---|---|
| Fuller Frank Ben | -- | None Available | |
| Fuller Frank Ben | $89,000 | None Available | |
| Square Deal Llc | -- | None Available | |
| Secretary Of Housing & Urban Development | $161,751 | None Available | |
| Polanco Sandoval Jose A | $24,500 | None Available | |
| Polanco Sandoval A | $145,000 | -- |
Source: Public Records
Mortgage History
| Date | Status | Borrower | Loan Amount |
|---|---|---|---|
| Previous Owner | Polanco Sandoval A | $130,000 |
Source: Public Records
Tax History
| Year | Tax Paid | Tax Assessment Tax Assessment Total Assessment is a certain percentage of the fair market value that is determined by local assessors to be the total taxable value of land and additions on the property. | Land | Improvement |
|---|---|---|---|---|
| 2025 | $2,080 | $264,725 | $102,200 | $162,525 |
| 2024 | $1,504 | $169,005 | $25,550 | $143,455 |
| 2023 | $1,406 | $169,005 | $25,550 | $143,455 |
| 2022 | $1,332 | $169,005 | $25,550 | $143,455 |
| 2021 | $1,071 | $169,005 | $25,550 | $143,455 |
| 2020 | $1,017 | $169,005 | $25,550 | $143,455 |
| 2019 | $1,017 | $169,005 | $25,550 | $143,455 |
| 2018 | $873 | $142,848 | $21,885 | $120,963 |
| 2017 | $864 | $142,848 | $21,885 | $120,963 |
| 2016 | $837 | $142,848 | $21,885 | $120,963 |
| 2015 | $1,147 | $161,489 | $24,472 | $137,017 |
| 2014 | $1,267 | $161,489 | $24,472 | $137,017 |
Source: Public Records
Map
Nearby Homes
- 3216 Hamlin Rd
- 4300 Jeffries Rd
- 2523 Hamlin Rd
- 3329 Broughton Dr
- 3519 E Geer St
- 4221 Amber Stone Way
- 4113 Lady Slipper Ln
- 4108 Lady Slipper Ln
- 2830 Tulip Poplar Cir
- 2927 Darrow Rd
- 2616 Bullock Rd
- 2810 Catamount Ct
- 2901 Kingston Ave
- 3927 Glenn Rd
- 2059 Glen Crossing Dr
- 1217 Tofino Dr
- 1213 Tofino Dr
- 3056 Fulong Dr
- 3058 Fulong Dr
- 3037 Fulong Dr
- 4516 Red Mill Rd
- 4412 Red Mill Rd
- 3814 Hamlin Rd
- 3818 Hamlin Rd
- 3719 Hamlin Rd
- 3721 Hamlin Rd
- 3811 Hamlin Rd
- 0 Red Mill Rd Unit 936599
- 0 Red Mill Rd Unit TR1792642
- 4002 Hamlin Rd
- 4008 Hamlin Rd
- 3404 Hamlin Rd
- 3306 Hamlin Rd
- 3322 Hamlin Rd
- 3623 Hamlin Rd
- 5214 Glenn Rd
- 4010 Hamlin Rd
- 3613 Hamlin Rd
- 3603 Hamlin Rd
- 3215 Hamlin Rd
Your Personal Tour Guide
Ask me questions while you tour the home.