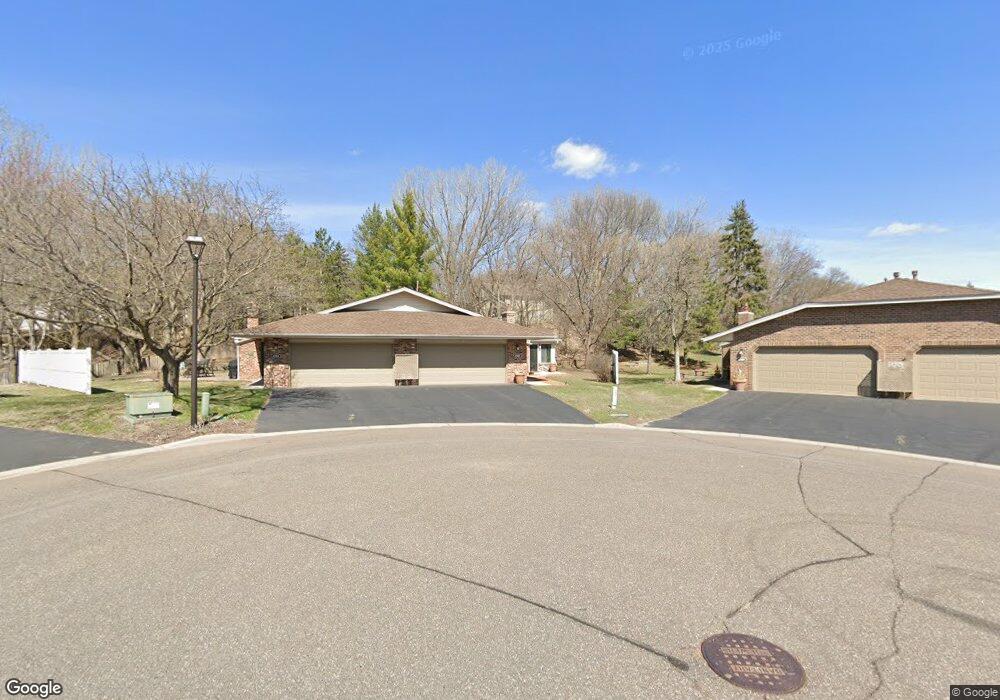
4505 Laramie Trail Minnetonka, MN 55345
Estimated Value: $334,000 - $363,000
2
Beds
2
Baths
1,379
Sq Ft
$254/Sq Ft
Est. Value
About This Home
This home is located at 4505 Laramie Trail, Minnetonka, MN 55345 and is currently estimated at $350,233, approximately $253 per square foot. 4505 Laramie Trail is a home located in Hennepin County with nearby schools including Groveland Elementary School, Minnetonka East Middle School, and Minnetonka Senior High School.
Ownership History
Date
Name
Owned For
Owner Type
Purchase Details
Closed on
Sep 5, 2018
Sold by
Kliner Lanz Molly and Nelson Katherine Mildred
Bought by
Kliner Lanz Molly
Current Estimated Value
Home Financials for this Owner
Home Financials are based on the most recent Mortgage that was taken out on this home.
Original Mortgage
$105,000
Outstanding Balance
$91,188
Interest Rate
4.5%
Mortgage Type
New Conventional
Estimated Equity
$259,045
Purchase Details
Closed on
Jul 26, 2018
Sold by
Reynolds Judith N and Reynolds Jeffrey
Bought by
Petrus Judith
Home Financials for this Owner
Home Financials are based on the most recent Mortgage that was taken out on this home.
Original Mortgage
$105,000
Outstanding Balance
$91,188
Interest Rate
4.5%
Mortgage Type
New Conventional
Estimated Equity
$259,045
Purchase Details
Closed on
May 24, 1999
Sold by
Seashore Lowell E and Seashore Susan
Bought by
Nelson Lester E and Nelson Katherine M
Create a Home Valuation Report for This Property
The Home Valuation Report is an in-depth analysis detailing your home's value as well as a comparison with similar homes in the area
Home Values in the Area
Average Home Value in this Area
Purchase History
| Date | Buyer | Sale Price | Title Company |
|---|---|---|---|
| Kliner Lanz Molly | -- | None Available | |
| Petrus Judith | $259,500 | Results Title | |
| Nelson Lester E | $140,000 | -- |
Source: Public Records
Mortgage History
| Date | Status | Borrower | Loan Amount |
|---|---|---|---|
| Open | Petrus Judith | $105,000 |
Source: Public Records
Tax History Compared to Growth
Tax History
| Year | Tax Paid | Tax Assessment Tax Assessment Total Assessment is a certain percentage of the fair market value that is determined by local assessors to be the total taxable value of land and additions on the property. | Land | Improvement |
|---|---|---|---|---|
| 2024 | $4,299 | $338,400 | $60,500 | $277,900 |
| 2023 | $4,087 | $332,300 | $60,500 | $271,800 |
| 2022 | $3,828 | $317,200 | $60,500 | $256,700 |
| 2021 | $3,532 | $286,500 | $55,000 | $231,500 |
| 2020 | $3,654 | $266,900 | $55,000 | $211,900 |
| 2019 | $3,584 | $264,700 | $55,000 | $209,700 |
| 2018 | $2,966 | $259,000 | $55,000 | $204,000 |
| 2017 | $2,983 | $217,800 | $55,000 | $162,800 |
| 2016 | $2,775 | $204,000 | $55,000 | $149,000 |
| 2015 | $2,126 | $162,300 | $51,000 | $111,300 |
| 2014 | -- | $159,200 | $50,000 | $109,200 |
Source: Public Records
Map
Nearby Homes
- 4553 Aspenwood Trail
- 4321 Lancelot Dr
- Manchester Plan at Ridgewood Ponds
- Broadmoor Plan at Ridgewood Ponds
- 17101 Highway 7
- 4829 Lamplighters Ln
- 4906 Bayswater Rd
- 4195 Hillcrest Ln
- 5034 Sparrow Rd
- 18408 Timber Ridge Dr
- 3900 Hillcrest Way
- 18213 Hermitage Way
- 16510 Lake Street Extension
- 4757 Spring Cir
- 4800 Woolman Ct
- 3922 Heathcote Rd
- 5130 Clear Spring Rd
- 17820 Valley Cove Ct
- 1651X Hidden Valley Rd
- 165xx Hidden Valley Rd
- 4509 Laramie Trail
- 4501 Laramie Trail
- 4515 Laramie Trail
- 4500 Redwood Cir
- 4408 Camelot Dr
- 4504 Redwood Cir
- 4500 Laramie Trail
- 4404 Camelot Dr
- 4517 Laramie Trail
- 4504 Laramie Trail
- 4516 Redwood Cir
- 4501 Redwood Cir
- 4521 Laramie Trail
- 4508 Laramie Trail
- 4512 Laramie Trail
- 4516 Laramie Trail
- 4520 Redwood Cir
- 4400 Camelot Dr
- 4412 Camelot Dr
- 4520 Laramie Trail