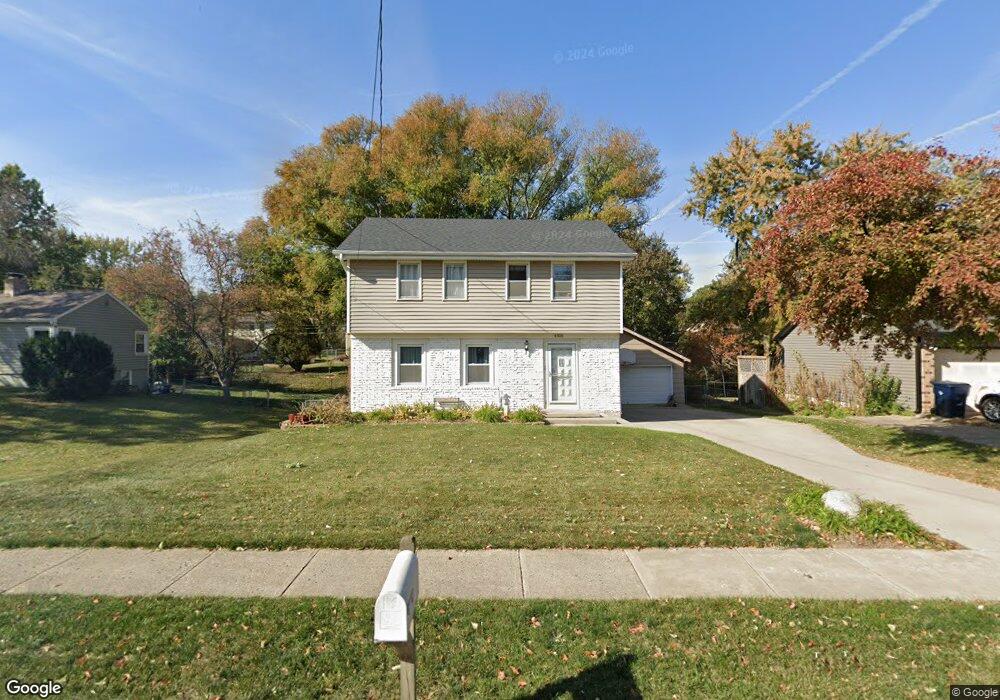
4506 66th St Urbandale, IA 50322
Estimated Value: $290,000 - $324,000
3
Beds
3
Baths
1,500
Sq Ft
$205/Sq Ft
Est. Value
About This Home
This home is located at 4506 66th St, Urbandale, IA 50322 and is currently estimated at $307,446, approximately $204 per square foot. 4506 66th St is a home located in Polk County with nearby schools including Urbandale Middle School, Urbandale High School, and St Pius X School.
Ownership History
Date
Name
Owned For
Owner Type
Purchase Details
Closed on
Dec 18, 2002
Sold by
Jones Vo Stephaney Ann and Vo Vinh
Bought by
Nuss Jeffrey D and Nuss Jodi M
Current Estimated Value
Home Financials for this Owner
Home Financials are based on the most recent Mortgage that was taken out on this home.
Original Mortgage
$119,400
Outstanding Balance
$51,251
Interest Rate
6.23%
Estimated Equity
$256,195
Create a Home Valuation Report for This Property
The Home Valuation Report is an in-depth analysis detailing your home's value as well as a comparison with similar homes in the area
Home Values in the Area
Average Home Value in this Area
Purchase History
| Date | Buyer | Sale Price | Title Company |
|---|---|---|---|
| Nuss Jeffrey D | $140,000 | -- |
Source: Public Records
Mortgage History
| Date | Status | Borrower | Loan Amount |
|---|---|---|---|
| Open | Nuss Jeffrey D | $119,400 |
Source: Public Records
Tax History Compared to Growth
Tax History
| Year | Tax Paid | Tax Assessment Tax Assessment Total Assessment is a certain percentage of the fair market value that is determined by local assessors to be the total taxable value of land and additions on the property. | Land | Improvement |
|---|---|---|---|---|
| 2025 | $4,888 | $294,900 | $62,100 | $232,800 |
| 2024 | $4,888 | $280,300 | $58,100 | $222,200 |
| 2023 | $4,596 | $280,300 | $58,100 | $222,200 |
| 2022 | $4,542 | $223,100 | $47,500 | $175,600 |
| 2021 | $4,384 | $223,100 | $47,500 | $175,600 |
| 2020 | $4,306 | $204,800 | $43,600 | $161,200 |
| 2019 | $4,104 | $204,800 | $43,600 | $161,200 |
| 2018 | $3,950 | $187,000 | $38,900 | $148,100 |
| 2017 | $3,674 | $187,000 | $38,900 | $148,100 |
| 2016 | $3,580 | $171,500 | $35,300 | $136,200 |
| 2015 | $3,580 | $171,500 | $35,300 | $136,200 |
| 2014 | $3,192 | $158,600 | $32,000 | $126,600 |
Source: Public Records
Map
Nearby Homes