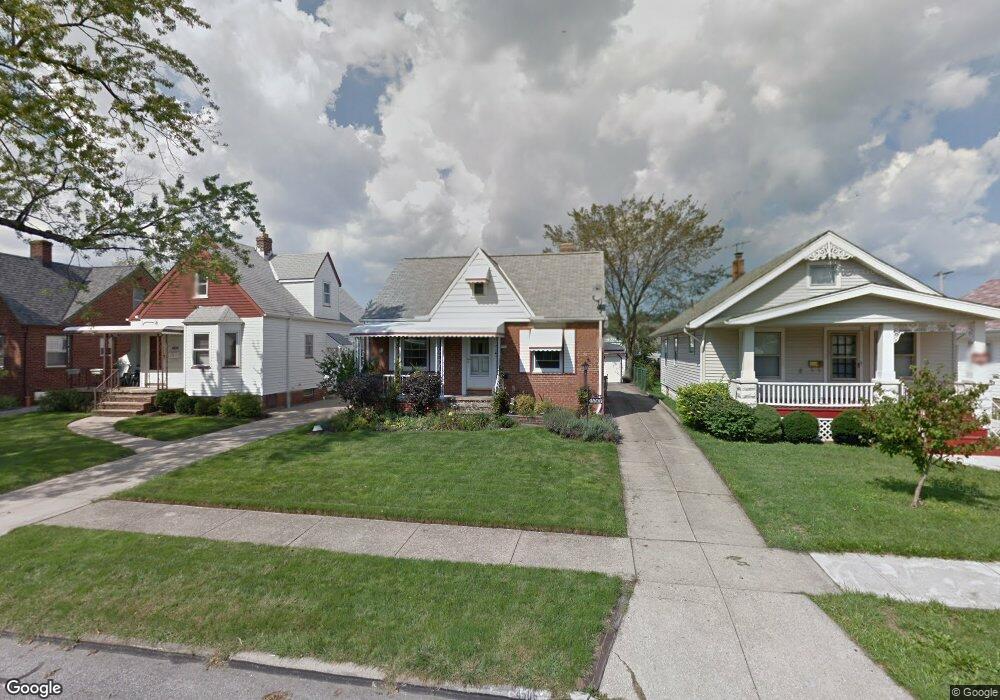
4506 Maplecrest Ave Cleveland, OH 44134
Estimated Value: $172,000 - $198,000
2
Beds
1
Bath
1,196
Sq Ft
$154/Sq Ft
Est. Value
About This Home
This home is located at 4506 Maplecrest Ave, Cleveland, OH 44134 and is currently estimated at $183,615, approximately $153 per square foot. 4506 Maplecrest Ave is a home located in Cuyahoga County with nearby schools including Shiloh Middle School, John Muir Elementary School, and Normandy High School.
Ownership History
Date
Name
Owned For
Owner Type
Purchase Details
Closed on
Jul 25, 2002
Sold by
Goodnough Steven D and Goodnough Carole N
Bought by
Kern Shari
Current Estimated Value
Home Financials for this Owner
Home Financials are based on the most recent Mortgage that was taken out on this home.
Original Mortgage
$91,300
Outstanding Balance
$38,951
Interest Rate
6.8%
Estimated Equity
$144,664
Purchase Details
Closed on
Jul 9, 1996
Sold by
Wright Fejeania L
Bought by
Goodnough Steven D and Goodnough Carole N
Home Financials for this Owner
Home Financials are based on the most recent Mortgage that was taken out on this home.
Original Mortgage
$95,143
Interest Rate
8.07%
Mortgage Type
FHA
Purchase Details
Closed on
Oct 10, 1986
Sold by
Scheutzow Diane
Bought by
Wright Fejeania L
Purchase Details
Closed on
Dec 16, 1977
Sold by
Kaczmarek Ronald and Kaczmarek Donna M
Bought by
Scheutzow Diane
Purchase Details
Closed on
Jan 1, 1975
Bought by
Kaczmarek Ronald and Kaczmarek Donna M
Create a Home Valuation Report for This Property
The Home Valuation Report is an in-depth analysis detailing your home's value as well as a comparison with similar homes in the area
Home Values in the Area
Average Home Value in this Area
Purchase History
| Date | Buyer | Sale Price | Title Company |
|---|---|---|---|
| Kern Shari | $114,500 | American Home Title Ltd | |
| Goodnough Steven D | $95,200 | -- | |
| Wright Fejeania L | $58,500 | -- | |
| Scheutzow Diane | $41,900 | -- | |
| Kaczmarek Ronald | -- | -- |
Source: Public Records
Mortgage History
| Date | Status | Borrower | Loan Amount |
|---|---|---|---|
| Open | Kern Shari | $91,300 | |
| Previous Owner | Goodnough Steven D | $95,143 | |
| Closed | Kern Shari | $11,600 |
Source: Public Records
Tax History
| Year | Tax Paid | Tax Assessment Tax Assessment Total Assessment is a certain percentage of the fair market value that is determined by local assessors to be the total taxable value of land and additions on the property. | Land | Improvement |
|---|---|---|---|---|
| 2024 | $3,246 | $52,885 | $10,080 | $42,805 |
| 2023 | $3,020 | $42,430 | $8,020 | $34,410 |
| 2022 | $2,991 | $42,420 | $8,015 | $34,405 |
| 2021 | $3,076 | $42,420 | $8,020 | $34,410 |
| 2020 | $2,693 | $32,620 | $6,160 | $26,460 |
| 2019 | $2,577 | $93,200 | $17,600 | $75,600 |
| 2018 | $2,593 | $32,620 | $6,160 | $26,460 |
| 2017 | $2,524 | $29,650 | $4,830 | $24,820 |
| 2016 | $2,510 | $29,650 | $4,830 | $24,820 |
| 2015 | $2,524 | $29,650 | $4,830 | $24,820 |
| 2014 | $2,524 | $31,890 | $5,180 | $26,710 |
Source: Public Records
Map
Nearby Homes
- 4809 Wellington Ave
- 4424 Forestwood Dr
- 4717 Snow Rd
- 5916 W 54th St
- 5603 Allanwood Dr
- 5502 Hampstead Ave
- 5610 Renwood Dr
- 4011 Liggett Dr
- 3303 Ingleside Dr
- 3319 Norris Ave
- 5615 Snow Rd
- 5107 Krueger Ave
- 5706 Alber Ave
- 3255 Woodlawn Dr
- 5619 Snow Rd
- 3015 Parklane Dr
- 6302 W 54th St
- 3109 George Ave
- 4312 Kenmore Ave
- 3311 Priscilla Ave
- 4438 Maplecrest Ave
- 4510 Maplecrest Ave
- 4436 Maplecrest Ave
- 4514 Maplecrest Ave
- 4518 Maplecrest Ave
- 4430 Maplecrest Ave
- 4507 Redfern Rd
- 4511 Redfern Rd
- 4503 Redfern Rd
- 4515 Redfern Rd
- 4435 Redfern Rd
- 4522 Maplecrest Ave
- 4426 Maplecrest Ave
- 4519 Redfern Rd
- 4507 Maplecrest Ave
- 4503 Maplecrest Ave
- 4511 Maplecrest Ave
- 4431 Redfern Rd
- 4435 Maplecrest Ave
- 4515 Maplecrest Ave
Your Personal Tour Guide
Ask me questions while you tour the home.