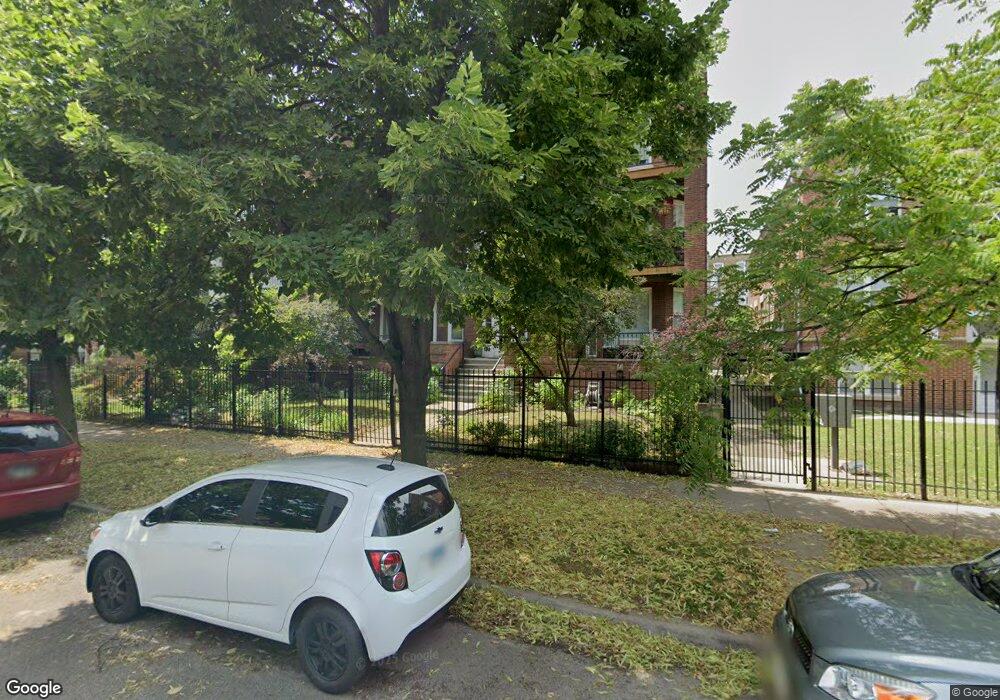
4506 N Magnolia Ave Unit 2S Chicago, IL 60640
Sheridan Park NeighborhoodEstimated Value: $414,000 - $496,000
2
Beds
--
Bath
11,520
Sq Ft
$39/Sq Ft
Est. Value
About This Home
This home is located at 4506 N Magnolia Ave Unit 2S, Chicago, IL 60640 and is currently estimated at $444,909, approximately $38 per square foot. 4506 N Magnolia Ave Unit 2S is a home located in Cook County with nearby schools including Senn High School, Chicago Montessori School, and St Mary Of The Lake School.
Ownership History
Date
Name
Owned For
Owner Type
Purchase Details
Closed on
Aug 30, 2017
Sold by
Kahng Lyn Sue
Bought by
Kahng Lyn Sue and Lyn Sue Kahng Revocable Trust
Current Estimated Value
Purchase Details
Closed on
Oct 25, 2006
Sold by
Staman Matthew W
Bought by
Kahng Lyn Sue
Home Financials for this Owner
Home Financials are based on the most recent Mortgage that was taken out on this home.
Original Mortgage
$244,000
Outstanding Balance
$146,267
Interest Rate
6.45%
Mortgage Type
Unknown
Estimated Equity
$298,642
Purchase Details
Closed on
Mar 27, 1998
Sold by
Vukic Sacir
Bought by
Foster Mark S and Banko Michael S
Home Financials for this Owner
Home Financials are based on the most recent Mortgage that was taken out on this home.
Original Mortgage
$142,500
Interest Rate
7.15%
Create a Home Valuation Report for This Property
The Home Valuation Report is an in-depth analysis detailing your home's value as well as a comparison with similar homes in the area
Home Values in the Area
Average Home Value in this Area
Purchase History
| Date | Buyer | Sale Price | Title Company |
|---|---|---|---|
| Kahng Lyn Sue | -- | None Available | |
| Kahng Lyn Sue | $305,000 | Chicago Title Insurance Co | |
| Foster Mark S | $145,000 | Mercury Title Company |
Source: Public Records
Mortgage History
| Date | Status | Borrower | Loan Amount |
|---|---|---|---|
| Open | Kahng Lyn Sue | $244,000 | |
| Previous Owner | Foster Mark S | $142,500 |
Source: Public Records
Tax History Compared to Growth
Tax History
| Year | Tax Paid | Tax Assessment Tax Assessment Total Assessment is a certain percentage of the fair market value that is determined by local assessors to be the total taxable value of land and additions on the property. | Land | Improvement |
|---|---|---|---|---|
| 2024 | $5,630 | $33,698 | $7,562 | $26,136 |
| 2023 | $5,467 | $30,000 | $6,090 | $23,910 |
| 2022 | $5,467 | $30,000 | $6,090 | $23,910 |
| 2021 | $5,363 | $29,999 | $6,090 | $23,909 |
| 2020 | $4,987 | $25,488 | $4,669 | $20,819 |
| 2019 | $5,009 | $28,362 | $4,669 | $23,693 |
| 2018 | $4,924 | $28,362 | $4,669 | $23,693 |
| 2017 | $4,707 | $25,243 | $4,060 | $21,183 |
| 2016 | $4,556 | $25,243 | $4,060 | $21,183 |
| 2015 | $4,145 | $25,243 | $4,060 | $21,183 |
| 2014 | $4,504 | $26,842 | $3,095 | $23,747 |
| 2013 | $4,404 | $26,842 | $3,095 | $23,747 |
Source: Public Records
Map
Nearby Homes
- 4538 N Malden St
- 4449 N Beacon St Unit 1N
- 4612 N Magnolia Ave
- 4606 N Malden St Unit GS
- 4606 N Malden St Unit 3S
- 4616 N Magnolia Ave Unit 1
- 4616 N Magnolia Ave Unit 3
- 4417 N Racine Ave Unit 1N
- 4603 N Racine Ave Unit 403
- 1353 W Wilson Ave Unit 2
- 4634 N Racine Ave Unit 3
- 4652 N Magnolia Ave
- 1410 W Sunnyside Ave Unit 1S
- 4715 N Racine Ave Unit 305
- 4731 N Malden St Unit 3S
- 4710 N Beacon St Unit 2S
- 4336 N Kenmore Ave Unit 1S
- 4537 N Greenview Ave
- 4516 N Sheridan Rd
- 1459 W Leland Ave Unit 3
- 4506 N Magnolia Ave Unit 1N
- 4506 N Magnolia Ave Unit 1S
- 4506 N Magnolia Ave Unit 3S
- 4508 N Magnolia Ave Unit 2N
- 4508 N Magnolia Ave Unit 3N
- 4502 N Magnolia Ave Unit 45023
- 4502 N Magnolia Ave Unit 45022
- 4502 N Magnolia Ave Unit 45021
- 4502 N Magnolia Ave Unit 1
- 4502 N Magnolia Ave Unit 1N
- 4502 N Magnolia Ave Unit 2N
- 1246 W Sunnyside Ave Unit 1246
- 1246 W Sunnyside Ave Unit 1246
- 1246 W Sunnyside Ave Unit 1246
- 1246 W Sunnyside Ave Unit 3
- 1246 W Sunnyside Ave Unit 1
- 4500 N Magnolia Ave Unit 45003
- 4500 N Magnolia Ave Unit 45002
- 4500 N Magnolia Ave Unit 45001
- 1244 W Sunnyside Ave Unit 1244