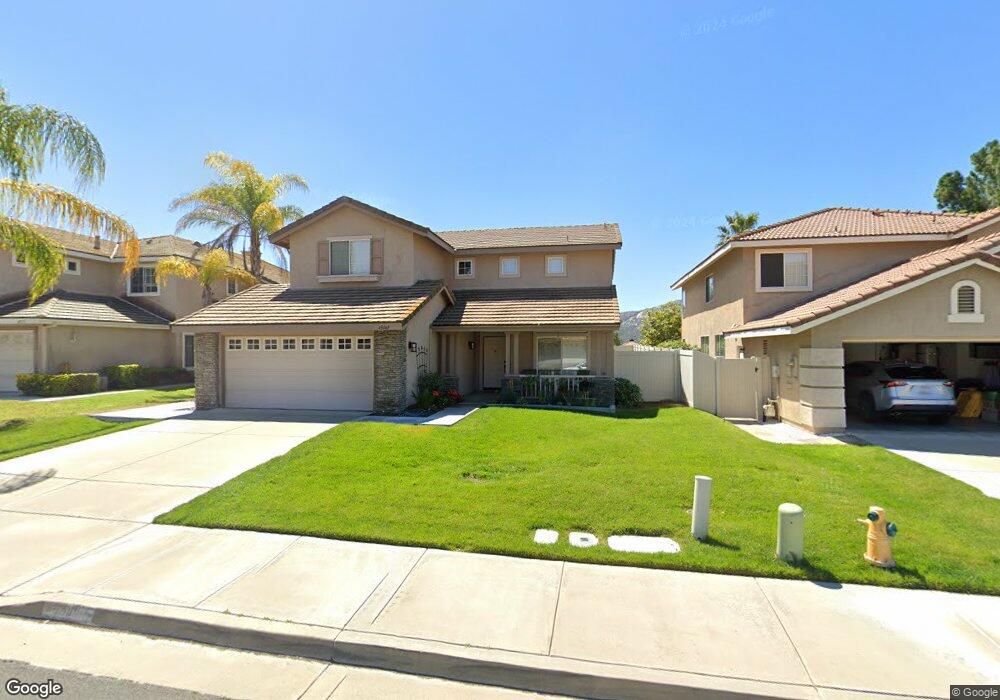
45069 Corte Camellia Temecula, CA 92592
Redhawk NeighborhoodEstimated Value: $680,167 - $726,000
3
Beds
3
Baths
1,898
Sq Ft
$374/Sq Ft
Est. Value
About This Home
This home is located at 45069 Corte Camellia, Temecula, CA 92592 and is currently estimated at $710,792, approximately $374 per square foot. 45069 Corte Camellia is a home located in Riverside County with nearby schools including Red Hawk Elementary, Erle Stanley Gardner Middle School, and Great Oak High School.
Ownership History
Date
Name
Owned For
Owner Type
Purchase Details
Closed on
Sep 19, 2022
Sold by
Wilson Georgia G
Bought by
Georgia G Wilson Living Trust and Wilson
Current Estimated Value
Purchase Details
Closed on
May 23, 2001
Sold by
Baxley Karla Lynn Walling
Bought by
Wilson Georgia G
Home Financials for this Owner
Home Financials are based on the most recent Mortgage that was taken out on this home.
Original Mortgage
$167,840
Interest Rate
7.14%
Mortgage Type
Purchase Money Mortgage
Purchase Details
Closed on
Mar 25, 1996
Sold by
Presley Homes
Bought by
Baxley Karla Lynn Walling
Home Financials for this Owner
Home Financials are based on the most recent Mortgage that was taken out on this home.
Original Mortgage
$139,454
Interest Rate
8.09%
Mortgage Type
FHA
Create a Home Valuation Report for This Property
The Home Valuation Report is an in-depth analysis detailing your home's value as well as a comparison with similar homes in the area
Home Values in the Area
Average Home Value in this Area
Purchase History
| Date | Buyer | Sale Price | Title Company |
|---|---|---|---|
| Georgia G Wilson Living Trust | -- | None Listed On Document | |
| Wilson Georgia G | $210,000 | First American Title Co | |
| Baxley Karla Lynn Walling | $142,000 | First American Title Ins Co |
Source: Public Records
Mortgage History
| Date | Status | Borrower | Loan Amount |
|---|---|---|---|
| Previous Owner | Wilson Georgia G | $167,840 | |
| Previous Owner | Baxley Karla Lynn Walling | $139,454 |
Source: Public Records
Tax History Compared to Growth
Tax History
| Year | Tax Paid | Tax Assessment Tax Assessment Total Assessment is a certain percentage of the fair market value that is determined by local assessors to be the total taxable value of land and additions on the property. | Land | Improvement |
|---|---|---|---|---|
| 2025 | $3,891 | $316,098 | $82,855 | $233,243 |
| 2023 | $3,891 | $303,826 | $79,639 | $224,187 |
| 2022 | $3,765 | $297,870 | $78,078 | $219,792 |
| 2021 | $3,682 | $292,031 | $76,548 | $215,483 |
| 2020 | $3,633 | $289,038 | $75,764 | $213,274 |
| 2019 | $3,584 | $283,372 | $74,279 | $209,093 |
| 2018 | $3,510 | $277,817 | $72,823 | $204,994 |
| 2017 | $3,445 | $272,371 | $71,396 | $200,975 |
| 2016 | $3,379 | $267,032 | $69,997 | $197,035 |
| 2015 | $3,318 | $263,023 | $68,947 | $194,076 |
| 2014 | $3,216 | $257,873 | $67,598 | $190,275 |
Source: Public Records
Map
Nearby Homes
- 31251 Strawberry Tree Ln
- 45495 Peacock Place
- 44989 Bellflower Ln
- 31186 Lavender Ct Unit 164
- 31191 Mountain Lilac Way
- 44984 Hawthorn St Unit 208
- 31163 Lavender Ct
- 45501 Jaguar Way
- 31409 Taylor Ln
- 45590 Alpine Place
- 31376 Taylor Ln
- 31593 Calle Los Padres
- 31054 Strawberry Tree Ln Unit 5
- 31937 Corte Montoya
- 31281 David Ln
- 44624 Clover Ln
- 45594 Calle Luna
- 31244 Locust Ct
- 31938 Calle Tiara S
- 45723 Pheasant Place
- 45063 Corte Camellia
- 45075 Corte Camellia
- 45057 Corte Camellia
- 45081 Corte Camellia
- 45132 Via Quivera
- 45138 Via Quivera
- 45126 Via Quivera
- 45146 Via Quivera
- 45087 Corte Camellia
- 45051 Corte Camellia
- 45120 Via Quivera
- 45152 Via Quivera
- 45066 Corte Camellia
- 45072 Corte Camellia
- 45060 Corte Camellia
- 45078 Corte Camellia
- 45158 Via Quivera
- 45093 Corte Camellia
- 45045 Corte Camellia
- 45054 Corte Camellia