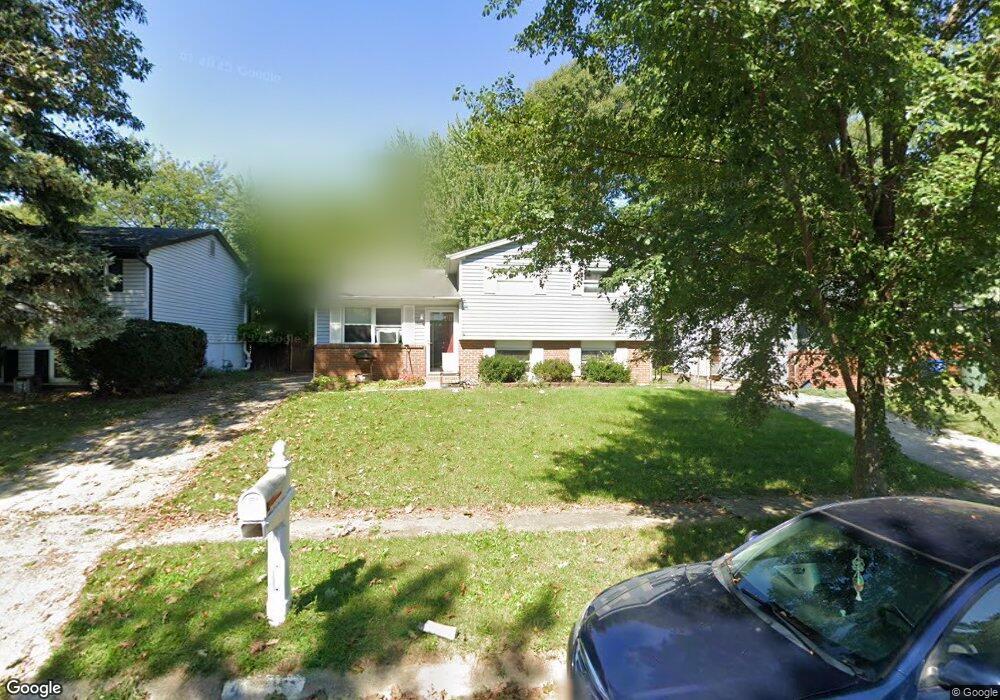
4507 Collingdale Rd Columbus, OH 43231
Parkview NeighborhoodEstimated Value: $238,000 - $269,000
3
Beds
1
Bath
1,426
Sq Ft
$178/Sq Ft
Est. Value
About This Home
This home is located at 4507 Collingdale Rd, Columbus, OH 43231 and is currently estimated at $254,435, approximately $178 per square foot. 4507 Collingdale Rd is a home located in Franklin County with nearby schools including Hawthorne Elementary School, Heritage Middle School, and Westerville South High School.
Ownership History
Date
Name
Owned For
Owner Type
Purchase Details
Closed on
May 28, 2008
Sold by
Beneficial Ohio Inc
Bought by
Madison Bryant K
Current Estimated Value
Home Financials for this Owner
Home Financials are based on the most recent Mortgage that was taken out on this home.
Original Mortgage
$77,287
Interest Rate
6.01%
Mortgage Type
FHA
Purchase Details
Closed on
Dec 12, 2007
Sold by
Coleman Winifred and Coleman Winifred E
Bought by
Beneficial Ohio Inc
Purchase Details
Closed on
Feb 3, 2003
Sold by
Coleman Lonnie A
Bought by
Coleman Winifred and Coleman Winifred E
Home Financials for this Owner
Home Financials are based on the most recent Mortgage that was taken out on this home.
Original Mortgage
$4,640
Interest Rate
6%
Mortgage Type
FHA
Purchase Details
Closed on
Mar 12, 1992
Bought by
Coleman Lonnie A
Purchase Details
Closed on
Sep 25, 1990
Purchase Details
Closed on
Oct 1, 1984
Create a Home Valuation Report for This Property
The Home Valuation Report is an in-depth analysis detailing your home's value as well as a comparison with similar homes in the area
Home Values in the Area
Average Home Value in this Area
Purchase History
| Date | Buyer | Sale Price | Title Company |
|---|---|---|---|
| Madison Bryant K | $78,500 | Sovereign | |
| Beneficial Ohio Inc | $90,000 | None Available | |
| Coleman Winifred | -- | -- | |
| Coleman Lonnie A | $65,500 | -- | |
| -- | $65,000 | -- | |
| -- | -- | -- |
Source: Public Records
Mortgage History
| Date | Status | Borrower | Loan Amount |
|---|---|---|---|
| Open | Madison Bryant K | $72,222 | |
| Closed | Madison Bryant K | $77,287 | |
| Previous Owner | Coleman Winifred | $109,232 | |
| Previous Owner | Coleman Winifred | $25,147 | |
| Previous Owner | Coleman Winifred E | $4,640 | |
| Previous Owner | Coleman Winifred | $81,000 |
Source: Public Records
Tax History Compared to Growth
Tax History
| Year | Tax Paid | Tax Assessment Tax Assessment Total Assessment is a certain percentage of the fair market value that is determined by local assessors to be the total taxable value of land and additions on the property. | Land | Improvement |
|---|---|---|---|---|
| 2024 | $3,129 | $61,290 | $22,580 | $38,710 |
| 2023 | $3,055 | $61,285 | $22,575 | $38,710 |
| 2022 | $3,103 | $47,530 | $9,940 | $37,590 |
| 2021 | $3,133 | $47,530 | $9,940 | $37,590 |
| 2020 | $3,123 | $47,530 | $9,940 | $37,590 |
| 2019 | $2,736 | $39,630 | $8,300 | $31,330 |
| 2018 | $2,810 | $39,630 | $8,300 | $31,330 |
| 2017 | $2,761 | $39,630 | $8,300 | $31,330 |
| 2016 | $2,788 | $36,860 | $8,720 | $28,140 |
| 2015 | $2,793 | $36,860 | $8,720 | $28,140 |
| 2014 | $2,746 | $36,860 | $8,720 | $28,140 |
| 2013 | $1,489 | $38,780 | $9,170 | $29,610 |
Source: Public Records
Map
Nearby Homes
- 3010 Bennington Ave
- 3098 Bennington Ave
- 2691 Northwold Rd
- 4279 Morsetown Ct
- 0 Ashbury Rd
- 4266 Morsetown Ct
- 2625 Clybourne Rd
- 2618 Clybourne Rd
- 2903 Kilbourne Ave
- 0 Abington Rd Unit 224031739
- 0 Abington Rd Unit 224031704
- 0 Abington Rd Unit 224031738
- 0 Abington Rd Unit 224031699
- 4216 Grayfriars Ln
- 0 Chester Rd
- 3084 Omega Dr
- 2594 Adda Ave
- 2576 Claridon Rd
- 2977 Ironstone Dr
- 4169 Commander Ln
- 4503 Collingdale Rd
- 4499 Collingdale Rd
- 4515 Collingdale Rd
- 4519 Collingdale Rd
- 4495 Collingdale Rd
- 4500 Collingdale Rd
- 4504 Collingdale Rd
- 4496 Collingdale Rd
- 4530 Arendell Place
- 4523 Collingdale Rd
- 4491 Collingdale Rd
- 4508 Collingdale Rd
- 4538 Arendell Place
- 4492 Collingdale Rd
- 4512 Collingdale Rd
- 2981 Arendell Ct
- 4487 Collingdale Rd
- 4488 Collingdale Rd
- 4522 Arendell Place
- 4516 Collingdale Rd