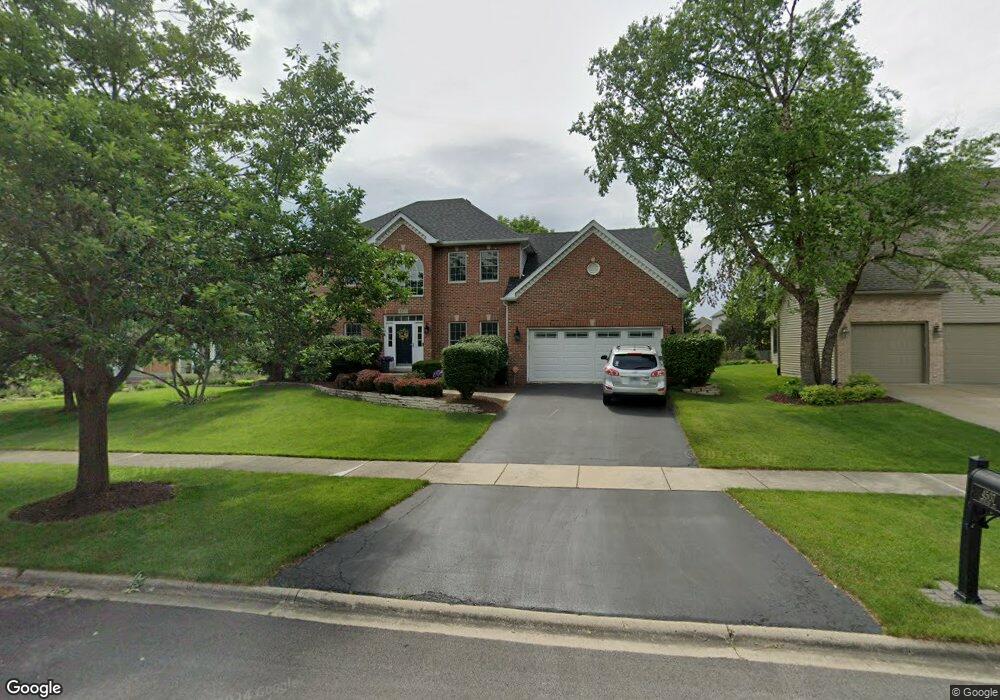
4507 Duncan Ct Naperville, IL 60564
Saddle Creek NeighborhoodEstimated Value: $704,000 - $773,000
Studio
1
Bath
2,368
Sq Ft
$309/Sq Ft
Est. Value
About This Home
This home is located at 4507 Duncan Ct, Naperville, IL 60564 and is currently estimated at $731,169, approximately $308 per square foot. 4507 Duncan Ct is a home located in Will County with nearby schools including Oliver Julian Kendall Elementary School, Clifford Crone Middle School, and Neuqua Valley High School.
Ownership History
Date
Name
Owned For
Owner Type
Purchase Details
Closed on
Feb 4, 2019
Sold by
Potter Jeffery M and Potter Ofelia M
Bought by
Potter Ofelia M and Potter Jeffery M
Current Estimated Value
Purchase Details
Closed on
Jun 23, 2000
Sold by
Zamec Curtis J and Zamec Jane E
Bought by
Potter Jeffery M and Potter Ofelia M
Home Financials for this Owner
Home Financials are based on the most recent Mortgage that was taken out on this home.
Original Mortgage
$470,900
Outstanding Balance
$162,813
Interest Rate
7.95%
Estimated Equity
$568,356
Purchase Details
Closed on
Dec 23, 1998
Sold by
Firstar Bank Illinois
Bought by
Lakewest Builders Inc
Home Financials for this Owner
Home Financials are based on the most recent Mortgage that was taken out on this home.
Original Mortgage
$720,000
Interest Rate
6.76%
Mortgage Type
Construction
Create a Home Valuation Report for This Property
The Home Valuation Report is an in-depth analysis detailing your home's value as well as a comparison with similar homes in the area
Home Values in the Area
Average Home Value in this Area
Purchase History
| Date | Buyer | Sale Price | Title Company |
|---|---|---|---|
| Potter Ofelia M | -- | Chicago Title Insurance Co | |
| Potter Jeffery M | $339,000 | -- | |
| Lakewest Builders Inc | $66,000 | -- |
Source: Public Records
Mortgage History
| Date | Status | Borrower | Loan Amount |
|---|---|---|---|
| Open | Potter Jeffery M | $470,900 | |
| Previous Owner | Lakewest Builders Inc | $720,000 |
Source: Public Records
Tax History
| Year | Tax Paid | Tax Assessment Tax Assessment Total Assessment is a certain percentage of the fair market value that is determined by local assessors to be the total taxable value of land and additions on the property. | Land | Improvement |
|---|---|---|---|---|
| 2024 | $12,307 | $198,746 | $44,186 | $154,560 |
| 2023 | $12,307 | $175,571 | $39,034 | $136,537 |
| 2022 | $10,489 | $153,625 | $36,926 | $116,699 |
| 2021 | $9,461 | $135,883 | $35,167 | $100,716 |
| 2020 | $9,280 | $133,730 | $34,610 | $99,120 |
| 2019 | $9,118 | $129,962 | $33,635 | $96,327 |
| 2018 | $8,945 | $125,404 | $32,895 | $92,509 |
| 2017 | $9,358 | $129,453 | $32,046 | $97,407 |
| 2016 | $9,339 | $126,666 | $31,356 | $95,310 |
| 2015 | $9,031 | $121,794 | $30,150 | $91,644 |
| 2014 | $9,031 | $113,983 | $30,150 | $83,833 |
| 2013 | $9,031 | $113,983 | $30,150 | $83,833 |
Source: Public Records
Map
Nearby Homes
- 4507 Barr Creek Ln
- 4711 Snapjack Cir
- 1736 Robert Ln
- 2255 Wendt Cir
- 2703 Wait Rd Unit 3
- 3720 Mandeville Ln
- 3740 Caine Dr
- 2344 Corn Lily Rd
- 3819 Capri Ct
- 3847 Gold Cup Ln
- 2512 Champion Rd
- 620 Switchgrass Way Unit 61006
- 2339 Ryegrass Ln Unit 64005
- 620 Redtop Way
- 2335 Ryegrass Ln Unit 64004
- 3804 Relstar Ct
- 688 Switchgrass Way Unit 57003
- 596 Redtop Way
- 23251 W Allagash Dr
- 12021 S Stallion Dr
- 4503 Duncan Ct
- 4511 Duncan Ct Unit 4
- 2108 Snow Creek Rd
- 4508 Pipestone Ct Unit 4
- 4512 Pipestone Ct Unit 4
- 4515 Duncan Ct
- 2012 Snow Creek Rd
- 4504 Pipestone Ct
- 4516 Pipestone Ct
- 4516 Duncan Ct
- 2103 Snow Creek Rd
- 2019 Snow Creek Rd
- 4512 Duncan Ct
- 4508 Duncan Ct
- 2107 Snow Creek Rd
- 2015 Snow Creek Rd
- 4520 Pipestone Ct
- 2111 Snow Creek Rd
- 2011 Snow Creek Rd
- 2004 Snow Creek Rd
Your Personal Tour Guide
Ask me questions while you tour the home.