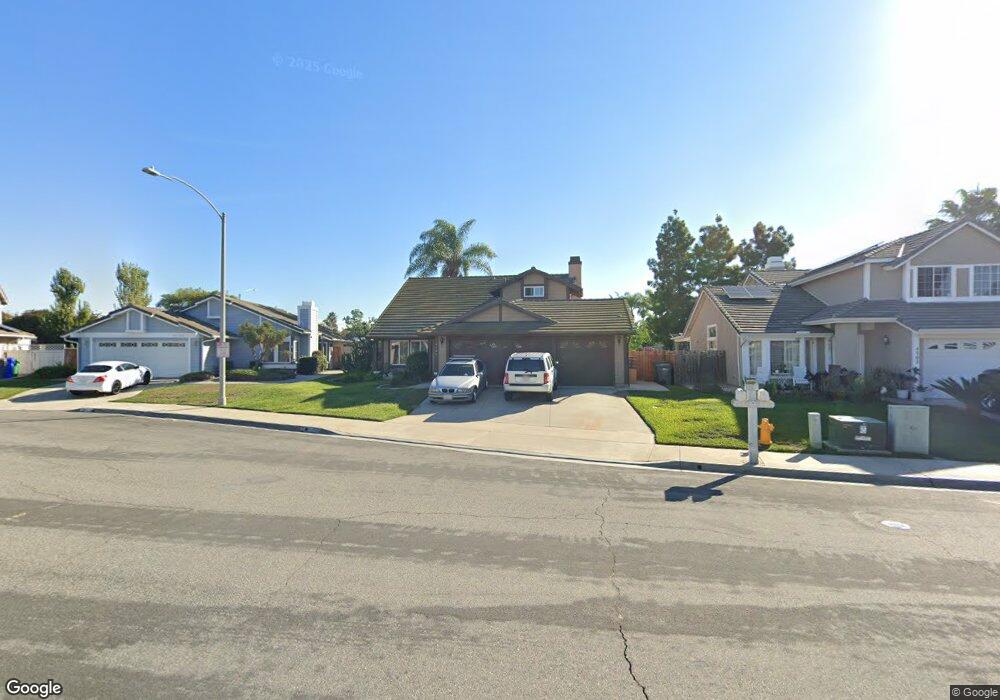
4507 Inverness Dr Oceanside, CA 92057
North Valley NeighborhoodEstimated Value: $835,000 - $886,000
3
Beds
3
Baths
1,722
Sq Ft
$501/Sq Ft
Est. Value
About This Home
This home is located at 4507 Inverness Dr, Oceanside, CA 92057 and is currently estimated at $862,694, approximately $500 per square foot. 4507 Inverness Dr is a home located in San Diego County with nearby schools including Reynolds Elementary School, Martin Luther King Jr. Middle School, and El Camino High School.
Ownership History
Date
Name
Owned For
Owner Type
Purchase Details
Closed on
Oct 21, 2003
Sold by
Fair Elisa
Bought by
Fair Leon and Fair Elisa
Current Estimated Value
Home Financials for this Owner
Home Financials are based on the most recent Mortgage that was taken out on this home.
Original Mortgage
$290,250
Outstanding Balance
$140,442
Interest Rate
6.75%
Mortgage Type
Unknown
Estimated Equity
$722,252
Purchase Details
Closed on
Jul 24, 2002
Sold by
Fair Leon
Bought by
Fair Elisa
Home Financials for this Owner
Home Financials are based on the most recent Mortgage that was taken out on this home.
Original Mortgage
$264,000
Interest Rate
8.8%
Purchase Details
Closed on
Jul 23, 2002
Sold by
Va
Bought by
Fair Leon and Fair Elisa
Home Financials for this Owner
Home Financials are based on the most recent Mortgage that was taken out on this home.
Original Mortgage
$264,000
Interest Rate
8.8%
Purchase Details
Closed on
Jan 8, 1999
Sold by
Engrasci Craig A and Engrasci Sheri I
Bought by
Va
Purchase Details
Closed on
Sep 28, 1990
Create a Home Valuation Report for This Property
The Home Valuation Report is an in-depth analysis detailing your home's value as well as a comparison with similar homes in the area
Home Values in the Area
Average Home Value in this Area
Purchase History
| Date | Buyer | Sale Price | Title Company |
|---|---|---|---|
| Fair Leon | -- | United Title Company | |
| Fair Elisa | -- | Fidelity National Title | |
| Fair Leon | -- | Fidelity National Title | |
| Va | $181,500 | Chicago Title Co | |
| -- | $190,000 | -- |
Source: Public Records
Mortgage History
| Date | Status | Borrower | Loan Amount |
|---|---|---|---|
| Open | Fair Leon | $290,250 | |
| Closed | Fair Elisa | $264,000 |
Source: Public Records
Tax History
| Year | Tax Paid | Tax Assessment Tax Assessment Total Assessment is a certain percentage of the fair market value that is determined by local assessors to be the total taxable value of land and additions on the property. | Land | Improvement |
|---|---|---|---|---|
| 2025 | $1,400 | $284,513 | $94,049 | $190,464 |
| 2024 | $1,400 | $278,935 | $92,205 | $186,730 |
| 2023 | $5,626 | $273,467 | $90,398 | $183,069 |
| 2022 | $5,692 | $268,106 | $88,626 | $179,480 |
| 2021 | $5,689 | $262,850 | $86,889 | $175,961 |
| 2020 | $5,632 | $260,156 | $85,999 | $174,157 |
| 2019 | $5,603 | $255,056 | $84,313 | $170,743 |
| 2018 | $5,604 | $250,056 | $82,660 | $167,396 |
| 2017 | $71 | $245,154 | $81,040 | $164,114 |
| 2016 | $5,534 | $240,348 | $79,451 | $160,897 |
| 2015 | $5,497 | $236,739 | $78,258 | $158,481 |
| 2014 | $1,290 | $232,103 | $76,726 | $155,377 |
Source: Public Records
Map
Nearby Homes
- 4475 Saint Andrews Place
- 4467 Anne Sladon St
- 4471 La Quinta Place
- 4499 Pebble Beach Dr
- 625 Sumner Way Unit 4
- 4484 Brisbane Way Unit 3
- 641 Sumner Way Unit 1
- 4616 N River Rd Unit 8
- 231 Riverview Way
- 4621 Avery St
- 813 Sunningdale Dr
- 4422 Point Degada
- 4413 Point Degada
- 265 Securidad St
- 4660 N River Rd Unit 150
- 4660 N River Rd Unit 116
- 4660 N River Rd Unit 136
- 4660 N River Rd Unit 17
- 241 Del Mesa St
- 505 Portico Dr
- 4503 Inverness Dr
- 4511 Inverness Dr
- 4499 Inverness Dr
- 4515 Inverness Dr
- 4504 Inverness Dr
- 4495 Inverness Dr
- 4516 Inverness Dr
- 4508 Inverness Dr
- 4512 Inverness Dr
- 4448 San Joaquin St
- 667 Foxwood Dr
- 4450 San Joaquin St
- 4446 San Joaquin St
- 4491 Inverness Dr
- 4410 Jill St
- 4408 Jill St
- 4452 San Joaquin St
- 4444 San Joaquin St
- 671 Foxwood Dr
- 4509 Meadowrun Dr
Your Personal Tour Guide
Ask me questions while you tour the home.