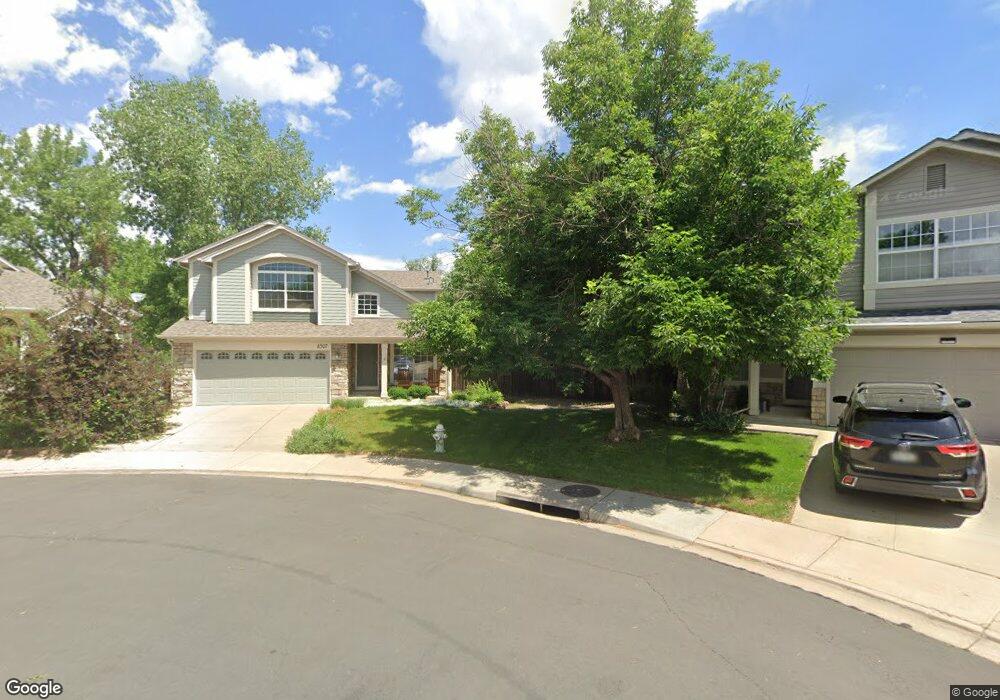
4507 Mulberry Ct Boulder, CO 80301
Gunbarrel NeighborhoodEstimated Value: $958,000 - $1,056,000
3
Beds
3
Baths
3,144
Sq Ft
$322/Sq Ft
Est. Value
About This Home
This home is located at 4507 Mulberry Ct, Boulder, CO 80301 and is currently estimated at $1,011,617, approximately $321 per square foot. 4507 Mulberry Ct is a home located in Boulder County with nearby schools including Crest View Elementary School, Centennial Middle School, and Boulder High School.
Ownership History
Date
Name
Owned For
Owner Type
Purchase Details
Closed on
Sep 13, 2001
Sold by
Kling John E and Kling Mary A
Bought by
Roettker William A
Current Estimated Value
Home Financials for this Owner
Home Financials are based on the most recent Mortgage that was taken out on this home.
Original Mortgage
$275,000
Outstanding Balance
$107,001
Interest Rate
6.96%
Estimated Equity
$904,616
Purchase Details
Closed on
Nov 30, 2000
Sold by
Kling John E and Kling Mary A
Bought by
Kling John E
Purchase Details
Closed on
Oct 23, 2000
Sold by
Kling Living Trust and John E
Bought by
Kling John E and Kling Mary A
Purchase Details
Closed on
Apr 12, 2000
Sold by
Kling John E and Kling Mary A
Bought by
Kling John E
Create a Home Valuation Report for This Property
The Home Valuation Report is an in-depth analysis detailing your home's value as well as a comparison with similar homes in the area
Home Values in the Area
Average Home Value in this Area
Purchase History
| Date | Buyer | Sale Price | Title Company |
|---|---|---|---|
| Roettker William A | $402,000 | -- | |
| Kling John E | -- | -- | |
| Kling John E | -- | -- | |
| Kling John E | -- | -- |
Source: Public Records
Mortgage History
| Date | Status | Borrower | Loan Amount |
|---|---|---|---|
| Open | Roettker William A | $275,000 |
Source: Public Records
Tax History Compared to Growth
Tax History
| Year | Tax Paid | Tax Assessment Tax Assessment Total Assessment is a certain percentage of the fair market value that is determined by local assessors to be the total taxable value of land and additions on the property. | Land | Improvement |
|---|---|---|---|---|
| 2025 | $5,783 | $65,106 | $20,175 | $44,931 |
| 2024 | $5,783 | $65,106 | $20,175 | $44,931 |
| 2023 | $5,683 | $65,801 | $22,103 | $47,382 |
| 2022 | $4,817 | $51,868 | $14,977 | $36,891 |
| 2021 | $4,593 | $53,360 | $15,408 | $37,952 |
| 2020 | $4,181 | $48,027 | $11,226 | $36,801 |
| 2019 | $4,117 | $48,027 | $11,226 | $36,801 |
| 2018 | $3,893 | $44,906 | $20,088 | $24,818 |
| 2017 | $3,772 | $49,646 | $22,208 | $27,438 |
| 2016 | $3,420 | $39,506 | $20,378 | $19,128 |
| 2015 | $3,238 | $35,303 | $16,000 | $19,303 |
| 2014 | $2,968 | $35,303 | $16,000 | $19,303 |
Source: Public Records
Map
Nearby Homes
- 5865 N Orchard Creek Cir
- 4650 White Rock Cir Unit 12
- 4658 White Rock Cir Unit 5
- 4471 Wellington Rd
- 4767 White Rock Cir Unit D
- 4763 White Rock Cir Unit A
- 4682 White Rock Cir Unit 5
- 4791 White Rock Cir Unit A
- 5920 Gunbarrel Ave Unit B
- 5922 Gunbarrel Ave Unit F
- 5932 Gunbarrel Ave Unit E
- 4839 White Rock Cir Unit D
- 5914 Gunbarrel Ave Unit F
- 5904 Gunbarrel Ave Unit B
- 4584 Robinson Place
- 5511 Pioneer Rd
- 6201 Willow Ln Unit 6201
- 6239 Willow Ln Unit 6239
- 4458 Driftwood Place
- 4056 63rd St
- 4503 Mulberry Ct
- 4510 Mulberry Ct
- 4501 Mulberry Ct
- 5877 S Orchard Creek Cir
- 4500 Mulberry Ct
- 5873 S Orchard Creek Cir
- 5878 Orchard Creek Ln
- 5867 S Orchard Creek Cir
- 5882 Orchard Creek Ln
- 5870 Orchard Creek Ln
- 5888 Orchard Creek Ln
- 5861 S Orchard Creek Cir
- 4461 Pembroke Gardens
- 4455 Pembroke Gardens
- 5866 Orchard Creek Ln
- 5894 Orchard Creek Ln
- 5855 S Orchard Creek Cir
- 4467 Pembroke Gardens
- 4445 Pembroke Gardens
- 5872 S Orchard Creek Cir