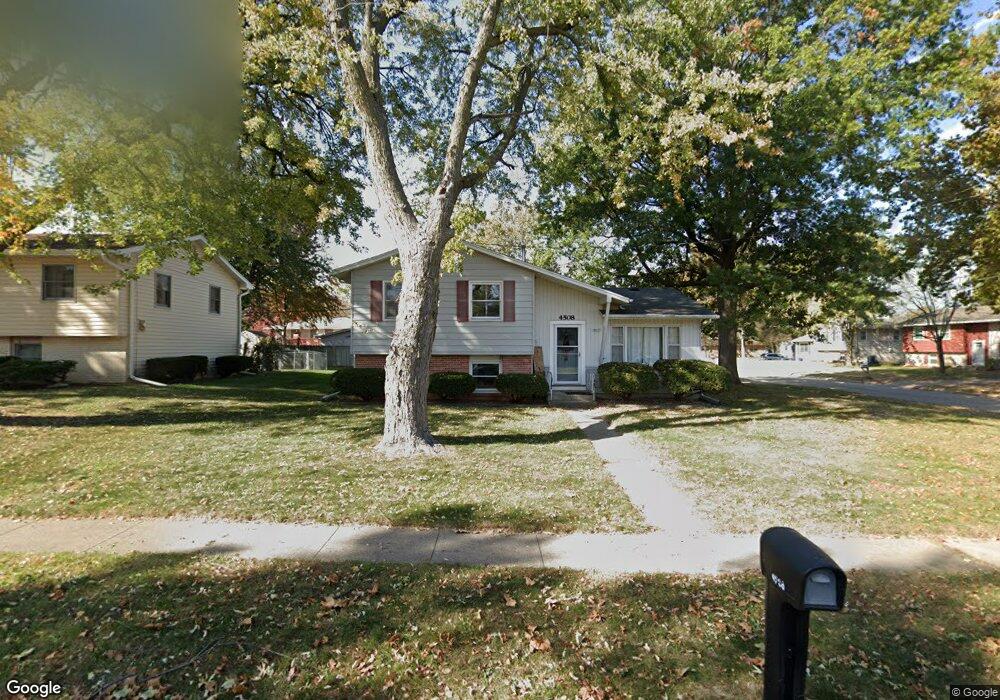
4508 64th St Urbandale, IA 50322
Estimated Value: $258,000 - $272,000
3
Beds
2
Baths
969
Sq Ft
$272/Sq Ft
Est. Value
About This Home
This home is located at 4508 64th St, Urbandale, IA 50322 and is currently estimated at $263,970, approximately $272 per square foot. 4508 64th St is a home located in Polk County with nearby schools including Urbandale Middle School, Urbandale High School, and St Pius X School.
Ownership History
Date
Name
Owned For
Owner Type
Purchase Details
Closed on
Jul 9, 2004
Sold by
Lynch Matthew J and Lynch Sherry S
Bought by
Hulse Kevin L and Hulse Jennifer D
Current Estimated Value
Home Financials for this Owner
Home Financials are based on the most recent Mortgage that was taken out on this home.
Original Mortgage
$127,924
Outstanding Balance
$64,080
Interest Rate
6.37%
Mortgage Type
Purchase Money Mortgage
Estimated Equity
$199,890
Create a Home Valuation Report for This Property
The Home Valuation Report is an in-depth analysis detailing your home's value as well as a comparison with similar homes in the area
Home Values in the Area
Average Home Value in this Area
Purchase History
| Date | Buyer | Sale Price | Title Company |
|---|---|---|---|
| Hulse Kevin L | $139,500 | -- |
Source: Public Records
Mortgage History
| Date | Status | Borrower | Loan Amount |
|---|---|---|---|
| Open | Hulse Kevin L | $127,924 |
Source: Public Records
Tax History Compared to Growth
Tax History
| Year | Tax Paid | Tax Assessment Tax Assessment Total Assessment is a certain percentage of the fair market value that is determined by local assessors to be the total taxable value of land and additions on the property. | Land | Improvement |
|---|---|---|---|---|
| 2025 | $3,770 | $230,300 | $59,800 | $170,500 |
| 2024 | $3,770 | $218,600 | $56,000 | $162,600 |
| 2023 | $3,532 | $218,600 | $56,000 | $162,600 |
| 2022 | $3,490 | $173,500 | $45,800 | $127,700 |
| 2021 | $3,362 | $173,500 | $45,800 | $127,700 |
| 2020 | $3,302 | $159,100 | $42,000 | $117,100 |
| 2019 | $3,144 | $159,100 | $42,000 | $117,100 |
| 2018 | $3,024 | $145,200 | $37,500 | $107,700 |
| 2017 | $2,808 | $145,200 | $37,500 | $107,700 |
| 2016 | $2,736 | $133,100 | $34,000 | $99,100 |
| 2015 | $2,736 | $133,100 | $34,000 | $99,100 |
| 2014 | $2,464 | $124,500 | $31,200 | $93,300 |
Source: Public Records
Map
Nearby Homes