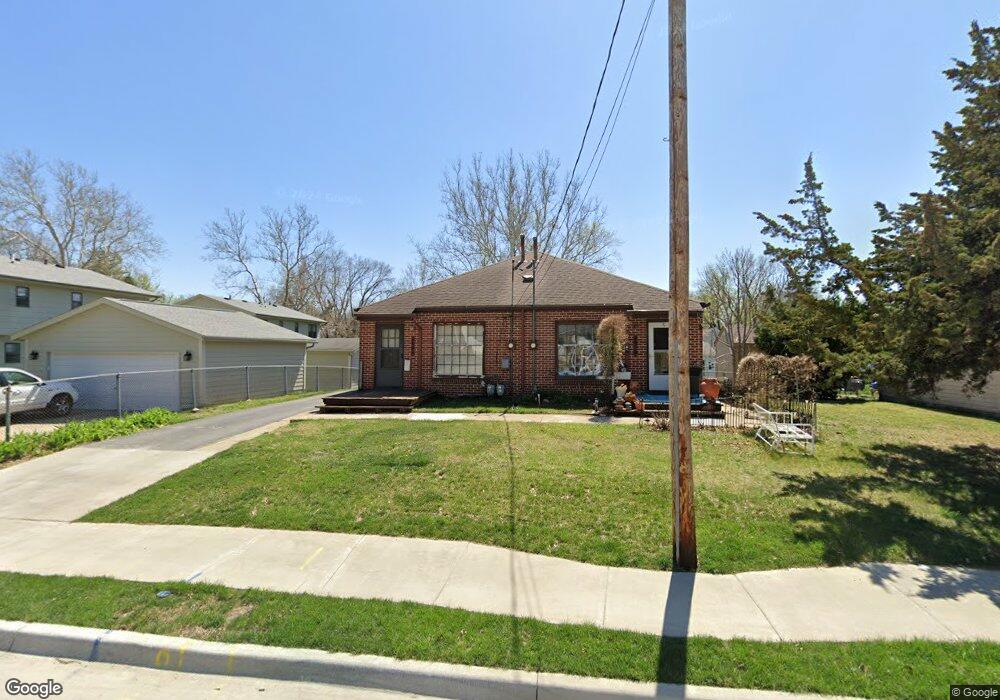
4508 Franklin Ave Des Moines, IA 50310
Waveland Park NeighborhoodEstimated Value: $203,000 - $268,277
3
Beds
2
Baths
1,444
Sq Ft
$170/Sq Ft
Est. Value
About This Home
This home is located at 4508 Franklin Ave, Des Moines, IA 50310 and is currently estimated at $246,069, approximately $170 per square foot. 4508 Franklin Ave is a home located in Polk County with nearby schools including Perkins Elementary School, Merrill Middle School, and Roosevelt High School.
Ownership History
Date
Name
Owned For
Owner Type
Purchase Details
Closed on
May 27, 2011
Sold by
Erickson Jeffrey and Erickson Faith
Bought by
1814 45Th Street Trust and Steven Patrick
Current Estimated Value
Purchase Details
Closed on
Apr 5, 2002
Sold by
Reinboth Harold C and Reinboth Joann L
Bought by
Festervand Aaron C
Home Financials for this Owner
Home Financials are based on the most recent Mortgage that was taken out on this home.
Original Mortgage
$99,750
Interest Rate
6.82%
Purchase Details
Closed on
Oct 24, 1991
Sold by
Chapman Gladys E
Bought by
Reinboth Harold C and Reinboth Joann L
Create a Home Valuation Report for This Property
The Home Valuation Report is an in-depth analysis detailing your home's value as well as a comparison with similar homes in the area
Home Values in the Area
Average Home Value in this Area
Purchase History
| Date | Buyer | Sale Price | Title Company |
|---|---|---|---|
| 1814 45Th Street Trust | $41,500 | None Available | |
| Festervand Aaron C | $104,500 | -- | |
| Reinboth Harold C | $19,500 | -- |
Source: Public Records
Mortgage History
| Date | Status | Borrower | Loan Amount |
|---|---|---|---|
| Previous Owner | Festervand Aaron C | $99,750 |
Source: Public Records
Tax History Compared to Growth
Tax History
| Year | Tax Paid | Tax Assessment Tax Assessment Total Assessment is a certain percentage of the fair market value that is determined by local assessors to be the total taxable value of land and additions on the property. | Land | Improvement |
|---|---|---|---|---|
| 2025 | $4,548 | $256,300 | $58,100 | $198,200 |
| 2024 | $4,548 | $231,200 | $51,500 | $179,700 |
| 2023 | $4,562 | $231,200 | $51,500 | $179,700 |
| 2022 | $4,528 | $193,600 | $45,500 | $148,100 |
| 2021 | $4,450 | $193,600 | $45,500 | $148,100 |
| 2020 | $4,622 | $178,300 | $41,500 | $136,800 |
| 2019 | $4,244 | $178,300 | $41,500 | $136,800 |
| 2018 | $4,200 | $157,900 | $36,300 | $121,600 |
| 2017 | $3,894 | $157,900 | $36,300 | $121,600 |
| 2016 | $3,794 | $144,000 | $32,500 | $111,500 |
| 2015 | $3,794 | $144,000 | $32,500 | $111,500 |
| 2014 | $3,586 | $135,000 | $29,900 | $105,100 |
Source: Public Records
Map
Nearby Homes