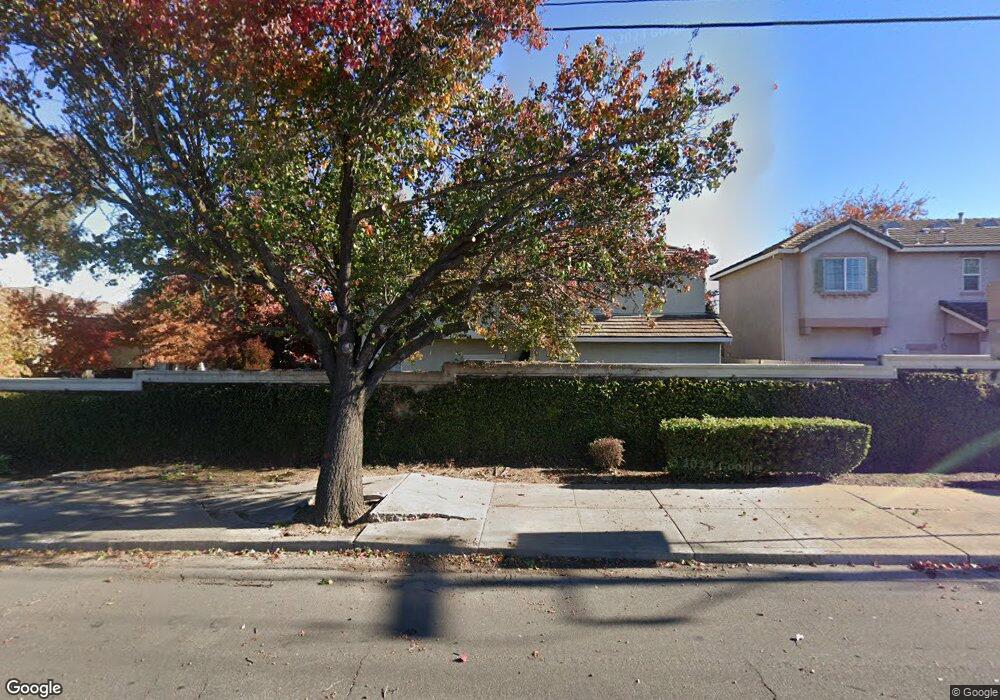
4508 Helens Oaks Cir Stockton, CA 95210
Estimated Value: $182,000 - $468,000
3
Beds
3
Baths
1,874
Sq Ft
$206/Sq Ft
Est. Value
About This Home
This home is located at 4508 Helens Oaks Cir, Stockton, CA 95210 and is currently estimated at $385,401, approximately $205 per square foot. 4508 Helens Oaks Cir is a home located in San Joaquin County with nearby schools including Rio Calaveras Elementary School, George W. Bush Elementary School, and Valentine Peyton Elementary School.
Ownership History
Date
Name
Owned For
Owner Type
Purchase Details
Closed on
Sep 22, 2009
Sold by
Bose Francis R and Bose Glenda D
Bought by
Cabral Miguel and Cabral Nancy R
Current Estimated Value
Home Financials for this Owner
Home Financials are based on the most recent Mortgage that was taken out on this home.
Original Mortgage
$75,000
Outstanding Balance
$48,925
Interest Rate
5.14%
Mortgage Type
New Conventional
Estimated Equity
$336,476
Purchase Details
Closed on
Aug 23, 2005
Sold by
Kimball Hill Homes California Inc
Bought by
Bose Francis R and Bose Glenda D
Home Financials for this Owner
Home Financials are based on the most recent Mortgage that was taken out on this home.
Original Mortgage
$278,550
Interest Rate
1.37%
Mortgage Type
Negative Amortization
Create a Home Valuation Report for This Property
The Home Valuation Report is an in-depth analysis detailing your home's value as well as a comparison with similar homes in the area
Home Values in the Area
Average Home Value in this Area
Purchase History
| Date | Buyer | Sale Price | Title Company |
|---|---|---|---|
| Cabral Miguel | $145,000 | Old Republic Title Company | |
| Bose Francis R | $348,190 | First Amer Title Co |
Source: Public Records
Mortgage History
| Date | Status | Borrower | Loan Amount |
|---|---|---|---|
| Open | Cabral Miguel | $75,000 | |
| Previous Owner | Bose Francis R | $278,550 |
Source: Public Records
Tax History Compared to Growth
Tax History
| Year | Tax Paid | Tax Assessment Tax Assessment Total Assessment is a certain percentage of the fair market value that is determined by local assessors to be the total taxable value of land and additions on the property. | Land | Improvement |
|---|---|---|---|---|
| 2025 | $2,354 | $187,155 | $46,464 | $140,691 |
| 2024 | $2,318 | $183,486 | $45,553 | $137,933 |
| 2023 | $2,266 | $179,889 | $44,660 | $135,229 |
| 2022 | $2,234 | $176,363 | $43,785 | $132,578 |
| 2021 | $2,148 | $172,906 | $42,927 | $129,979 |
| 2020 | $2,190 | $171,134 | $42,487 | $128,647 |
| 2019 | $2,181 | $167,779 | $41,654 | $126,125 |
| 2018 | $2,141 | $164,490 | $40,838 | $123,652 |
| 2017 | $2,030 | $161,266 | $40,038 | $121,228 |
| 2016 | $2,067 | $158,105 | $39,254 | $118,851 |
| 2014 | $1,969 | $152,682 | $37,907 | $114,775 |
Source: Public Records
Map
Nearby Homes
- 4450 Oakfield Dr
- 4705 Cayman Ct
- 1608 Bonaire Cir
- 1750 Bonaire Cir
- 4503 White Forge Dr
- 4233 Verdant St
- The Discovery Plan at Calaveras Place
- 908 Terranova Ct
- 4437 Harmony Hill Way
- 4028 Trieste Cir
- 3984 Monique Cir
- 4428 Calandria St Unit 4
- 833 E Essex St
- 4463 Townehome Dr
- 1829 Mighty Oak Dr
- 705 Spirou St
- 4478 Calandria St Unit 4
- 428 Caribrook Way Unit 3
- 510 E Bianchi Rd Unit 2
- 422 Caribrook Way Unit 3
- 4504 Helens Oaks Cir
- 4498 Helens Oaks Cir
- 4516 Helens Oaks Cir
- 4481 Helens Oaks Cir
- 4485 Helens Oaks Cir
- 4486 Helens Oaks Cir
- 4494 Helens Oaks Cir
- 4520 Helens Oaks Cir
- 4532 Helens Oaks Cir
- 4490 Helens Oaks Cir
- 4477 Helens Oaks Cir
- 4404 Woodbine Dr
- 4524 Helens Oaks Cir
- 4482 Helens Oaks Cir
- 4410 Woodbine Dr
- 4528 Helens Oaks Cir
- 4416 Woodbine Dr
- 4478 Helens Oaks Cir
- 4473 Helens Oaks Cir
- 4469 Helens Oaks Cir