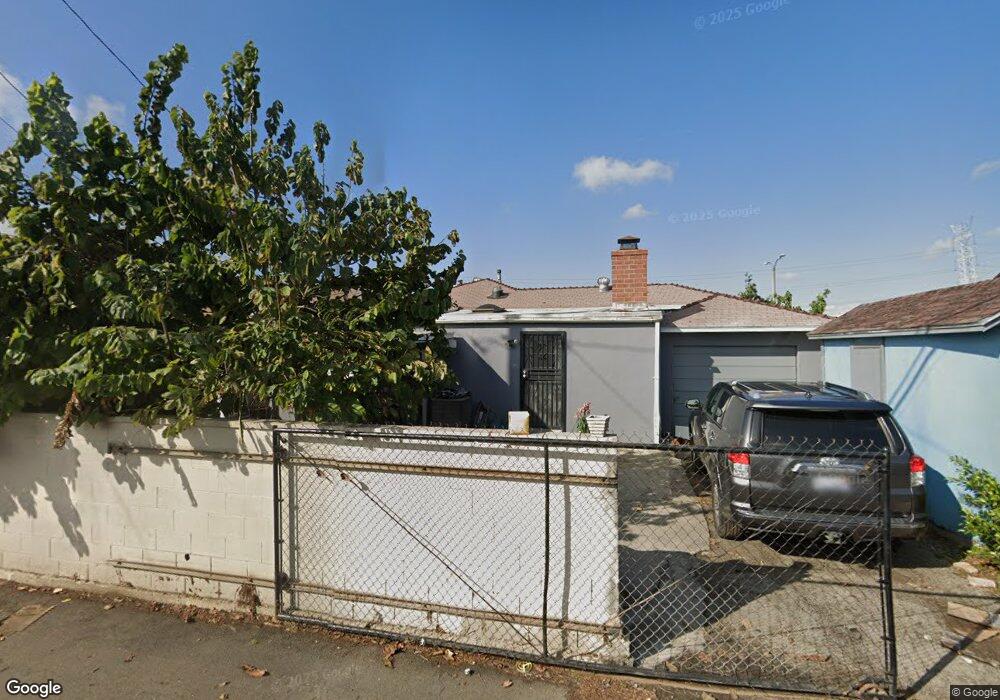
4508 Paramount Blvd Pico Rivera, CA 90660
Estimated Value: $721,643 - $854,000
3
Beds
1
Bath
1,391
Sq Ft
$554/Sq Ft
Est. Value
About This Home
This home is located at 4508 Paramount Blvd, Pico Rivera, CA 90660 and is currently estimated at $771,161, approximately $554 per square foot. 4508 Paramount Blvd is a home located in Los Angeles County with nearby schools including North Ranchito Elementary School, North Park Middle School, and Ruben Salazar Continuation School.
Ownership History
Date
Name
Owned For
Owner Type
Purchase Details
Closed on
Nov 17, 2020
Sold by
Chy Chinheng and Buth Kim Soth
Bought by
Chy Hunly
Current Estimated Value
Home Financials for this Owner
Home Financials are based on the most recent Mortgage that was taken out on this home.
Original Mortgage
$300,000
Outstanding Balance
$266,957
Interest Rate
2.8%
Mortgage Type
New Conventional
Estimated Equity
$504,204
Purchase Details
Closed on
Sep 13, 2014
Sold by
Oeng Maly Chheavly
Bought by
Chy Hunly
Home Financials for this Owner
Home Financials are based on the most recent Mortgage that was taken out on this home.
Original Mortgage
$319,400
Interest Rate
4.1%
Mortgage Type
New Conventional
Purchase Details
Closed on
Sep 17, 2002
Sold by
Fimbres Conrad C
Bought by
Chy Hunly
Home Financials for this Owner
Home Financials are based on the most recent Mortgage that was taken out on this home.
Original Mortgage
$145,000
Interest Rate
6.24%
Create a Home Valuation Report for This Property
The Home Valuation Report is an in-depth analysis detailing your home's value as well as a comparison with similar homes in the area
Home Values in the Area
Average Home Value in this Area
Purchase History
| Date | Buyer | Sale Price | Title Company |
|---|---|---|---|
| Chy Hunly | -- | Wfg National Title Ins Co | |
| Chy Hunly | -- | None Available | |
| Chy Hunly | $195,000 | Fidelity National Title Co |
Source: Public Records
Mortgage History
| Date | Status | Borrower | Loan Amount |
|---|---|---|---|
| Open | Chy Hunly | $300,000 | |
| Closed | Chy Hunly | $319,400 | |
| Closed | Chy Hunly | $145,000 |
Source: Public Records
Tax History
| Year | Tax Paid | Tax Assessment Tax Assessment Total Assessment is a certain percentage of the fair market value that is determined by local assessors to be the total taxable value of land and additions on the property. | Land | Improvement |
|---|---|---|---|---|
| 2025 | $6,015 | $426,770 | $300,963 | $125,807 |
| 2024 | $6,015 | $418,403 | $295,062 | $123,341 |
| 2023 | $5,849 | $410,200 | $289,277 | $120,923 |
| 2022 | $5,585 | $402,157 | $283,605 | $118,552 |
| 2021 | $5,458 | $394,273 | $278,045 | $116,228 |
| 2020 | $3,852 | $258,228 | $185,000 | $73,228 |
| 2019 | $3,782 | $253,166 | $181,373 | $71,793 |
| 2018 | $3,577 | $248,203 | $177,817 | $70,386 |
| 2016 | $3,231 | $238,566 | $170,913 | $67,653 |
| 2015 | $3,183 | $234,983 | $168,346 | $66,637 |
| 2014 | $3,144 | $230,381 | $165,049 | $65,332 |
Source: Public Records
Map
Nearby Homes
- 4424 Calada Ave
- 8630 Elba St
- 4660 Paramount Blvd
- 8509 Beverly Blvd Unit 76
- 8509 Beverly Blvd Unit 24
- 8835 Las Posas St
- 4288 Rosemead Blvd Unit 25
- 4139 Paramount Blvd Unit 18
- 4724 Orange St
- 4753 Orange St
- 4508 Deland Ave
- 8939 Gallatin Rd Unit 16
- 9035 Hightree St
- 4739 Ivy St
- 4918 Rosemead Blvd
- 424 Bradley Ave
- 9419 Beverly Blvd
- 9323 Via Azul
- 9327 Via Azul
- 9329 Via Azul
- 4502 Paramount Blvd
- 4512 Paramount Blvd
- 4454 Paramount Blvd
- 4518 Paramount Blvd
- 4527 Calico Ave
- 4551 Calico Ave
- 4523 Calico Ave
- 4557 Calico Ave
- 4450 Paramount Blvd
- 4522 Paramount Blvd
- 4517 Calico Ave
- 4561 Calico Ave
- 4508 Calada Ave
- 4502 Calada Ave
- 4444 Paramount Blvd
- 4511 Calico Ave
- 4514 Calada Ave
- 4595 Calico Ave
- 4575 Calico Ave
- 4520 Calada Ave
Your Personal Tour Guide
Ask me questions while you tour the home.